Key figures
Priorities defined
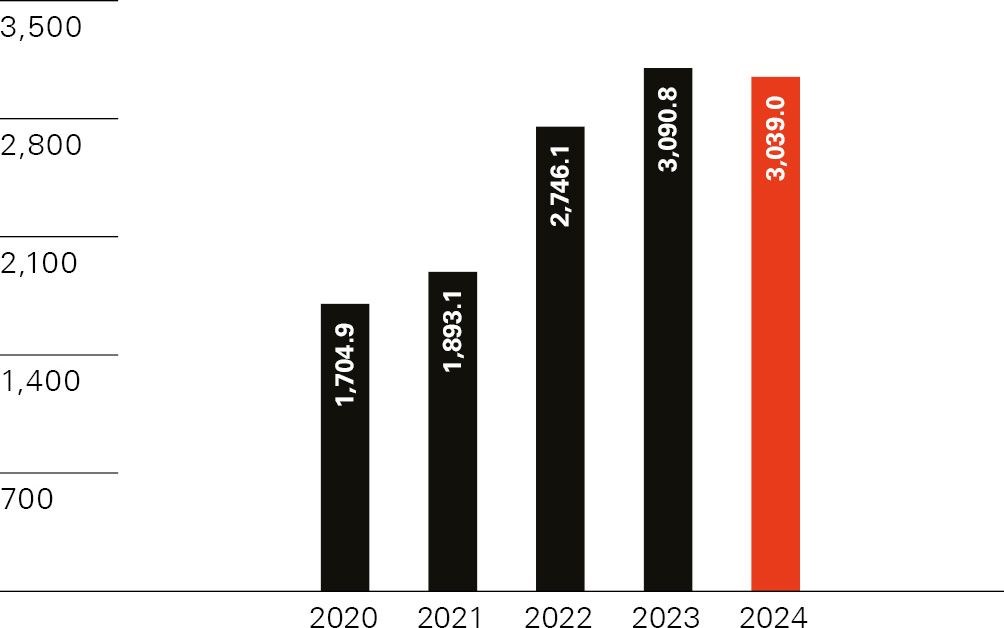
Slight decrease in sales due to currency effects
Third-party sales in CHF million
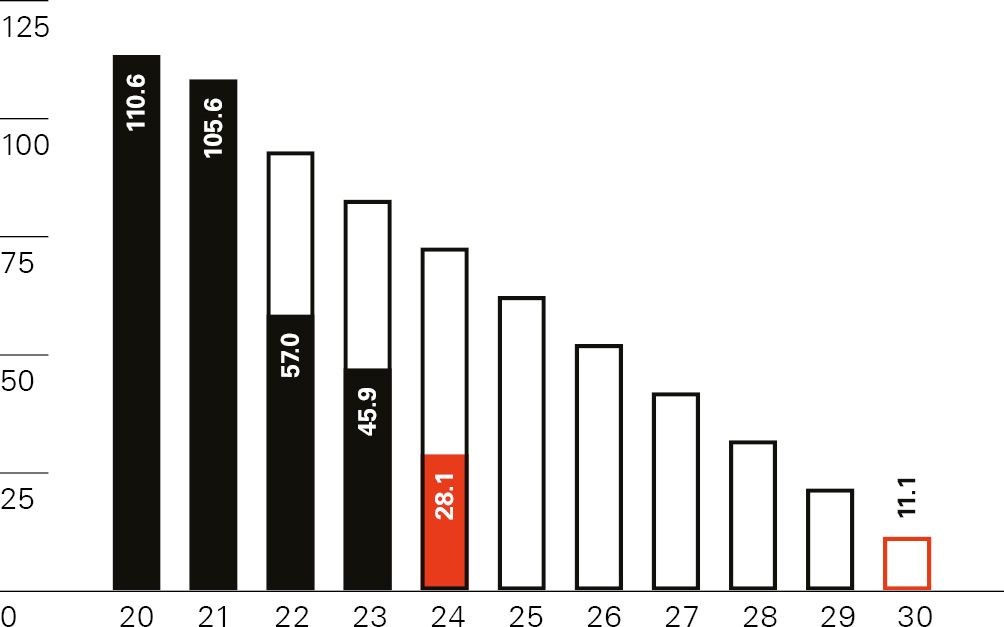
Emissions reduction (Scope 1+2) by –74.6% vs. 2020
CO2 emissions in metric tons/million value-added francs
Profitability impacted by mix effects
EBIT in % of net sales

Slight increase in accident rate
Number of accidents per million hours worked
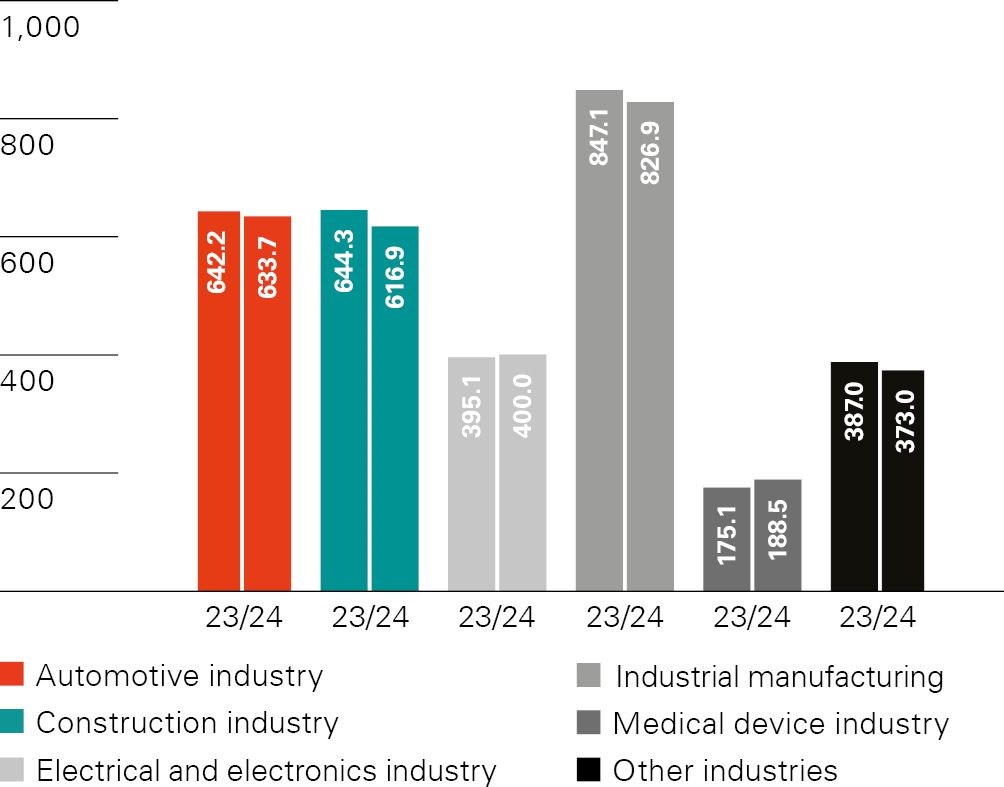
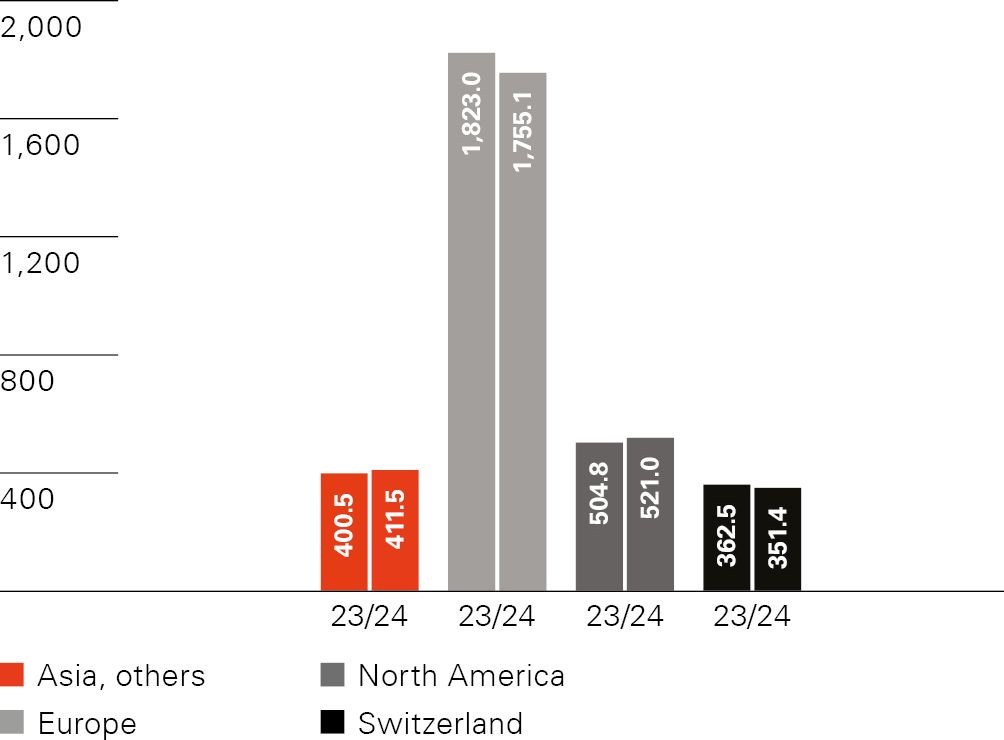
Challenging economic environment in Europe clearly visible
Sales by end market/region in CHF million
Steady performance
Income statement in CHF million | 2024 | 2023 | 2022 | 2021 | 2020 |
Third–party sales | 3,039.0 | 3,090.8 | 2,746.1 | 1,893.1 | 1,704.9 |
Change to previous year in % | –1.7 | 12.6 | 45.1 | 11.0 | –4.3 |
thereof currency effects | –1.9 | –4.1 | –1.9 | –0.1 | –4.1 |
thereof change in scope of consolidation | 0.1 | 14.6 | 37.9 | 0.8 | 3.0 |
thereof organic growth | 0.1 | 2.1 | 9.1 | 10.3 | –3.2 |
Net sales | 3,031.1 | 3,073.0 | 2,738.7 | 1,897.3 | 1,707.1 |
EBITDA | 479.8 | 486.0 | 448.1 | 407.1 | 327.6 |
in % of net sales | 15.8 | 15.8 | 16.4 | 21.5 | 19.2 |
Operating profit (EBIT) | 350.2 | 358.6 | 330.3 | 301.7 | 227.4 |
in % of net sales | 11.6 | 11.7 | 12.1 | 15.9 | 13.3 |
Operating profit (EBIT) adjusted1 | 350.2 | 358.6 | 353.2 | 298.6 | 225.3 |
in % of net sales | 11.6 | 11.7 | 12.9 | 15.7 | 13.2 |
Net income | 242.7 | 268.5 | 270.6 | 248.0 | 184.8 |
in % of net sales | 8.0 | 8.7 | 9.9 | 13.1 | 10.8 |
Balance sheet in CHF million | |||||
Assets | 2,612.2 | 2,546.8 | 2,574.2 | 1,839.1 | 1,684.1 |
Net cash (+)/debt (–) | –335.1 | –445.3 | –477.7 | 279.1 | 144.3 |
Equity | 1,559.2 | 1,375.7 | 1,303.6 | 1,450.4 | 1,278.2 |
in % of assets | 59.7 | 54.0 | 50.6 | 78.9 | 75.9 |
Cash flow statement in CHF million | |||||
Cash flow from operating activities | 375.0 | 313.4 | 287.9 | 324.5 | 296.4 |
Purchase of property, plant, equipment and intangible assets | –148.9 | –174.0 | –171.0 | –121.4 | –104.1 |
Acquisition (–)/Disposal (+) of subsidaries, net of cash | –17.1 | –10.3 | –519.1 | –7.6 | –59.5 |
Employees | |||||
Full-time equivalents (FTE) | 13,689 | 13,198 | 13,282 | 10,509 | 10,692 |
Financial key ratios (unaudited) | |||||
ROCE in %2 (Return on Capital Employed) | 19.4 | 20.4 | 22.7 | 26.1 | 19.9 |
ROIC in %2 (Return on Invested Capital) | 8.4 | 8.9 | 8.9 | 11.2 | 8.6 |
Non financial key ratios (unaudited) | |||||
CO2 emissions in metric tons/million value-added francs (Scope 1+2) | 28.1 | 45.9 | 57.0 | 105.6 | 110.6 |
Share of renewable electricity in % | 75.2 | 40.0 | 49.7 | 37.7 | 6.1 |
Accident rate in quantity/million hours | 4.1 | 4.0 | 4.0 | 4.1 | 4.7 |
Share key ratios | |||||
Earnings per share in CHF | 6.21 | 6.84 | 6.95 | 6.51 | 4.90 |
Payout per share in CHF3 | 2.50 | 2.50 | 2.50 | 2.20 | 1.80 |
Payout in CHF million | 97.3 | 97.2 | 97.2 | 82.0 | 67.5 |
Payout ratio in %4 | 40.3 | 36.5 | 36.4 | 33.6 | 36.7 |
1Adjustments are explained in the Information on the publication section
2Calculation of the key figure is shown in the Information on the publication section
3Proposed payout at SFS Group’s Annual General Meeting on April 30, 2025
4Calculation is based on the net income attributable to shareholders of SFS Group AG