Notes to the consolidated financial statements
SFS Group AG is a limited company according to Swiss law, incorporated and domiciled in Heerbrugg, municipality of Widnau/SG, Switzerland. SFS Group AG is the parent company of all SFS Group companies and therefore the ultimate holding company of the SFS Group.
All amounts are in CHF million unless otherwise stated and refer to December 31 for balance sheet items and to the financial year from January 1 to December 31 for items of the income statement.
The structure of the notes is as follows:
- General information
- Performance
- Capital employed
- Financing and risk management
- Group structure
- Events after the balance sheet date
The consolidated financial statements have been prepared in accordance with all of the existing accounting and reporting recommendations of Swiss GAAP FER. Swiss GAAP FER provides a true and fair view of the financial position of the SFS Group and of its financial performance. The financial statements are based on the principle of historical acquisition costs (except for securities and derivative financial instruments recognized at fair value) and are based on the going concern principle. The consolidated financial statements for the year ended December 31 comprise the company and its subsidiaries and the group’s interest in associates and joint ventures. The following new or revised accounting and reporting recommendations of Swiss GAAP FER have been applied for the first time in the reporting year:
- Swiss GAAP FER 28 “Government grants”
- Swiss GAAP FER 30 “Consolidated financial statements”
The minimal impacts due to the application of the above-mentioned new or revised standards have been considered in these consolidated financial statements.
The consolidated financial statements include the financial statements of SFS Group AG and all its Swiss and foreign subsidiaries. Using the full consolidation method, all assets and liabilities as well as the expenses and income of the subsidiaries controlled by SFS Group AG are included in the consolidated financial statements. Control is assumed when SFS Group AG directly or indirectly holds more than 50% of the voting rights of a subsidiary. Equity and profit or loss attributable to third parties are presented as separate line items in the consolidated balance sheet and consolidated income statement. The consolidated financial statements have been prepared based on the financial statements of the Group companies, which have been prepared in accordance with uniform Group accounting policies as of December 31.
Intercompany transactions, balances, income and expenses between Group companies are eliminated. Intercompany profits are eliminated.
The acquisition method is used to account for business combinations. Under this method, the acquiree’s net assets and liabilities are measured at their fair values using uniform Group accounting policies. Any excess of consideration transferred over the fair value of the net assets acquired is offset against equity. In case of disposal, acquired goodwill offset with equity at an earlier date is to be considered at original cost to determine the profit or loss recognized in the income statement.
Subsidiaries are fully consolidated from the date on which control is transferred to the Group. They are deconsolidated from the date that control ceases. Entities managed equally with an SFS external partner are called joint ventures. Joint control is established by contractual agreement. Strategic, financial and operating decisions require unanimous consent. Associates are those entities in which the Group exerts significant influence, but does not control the financial and operating policies. The group’s share of voting rights in joint ventures and associates are between 20% and 50%. SFS is entitled to its proportional share of the net assets. Goodwill (if any) is offset against equity.
Items included in the financial statements of each of the SFS Group’s entities are measured using the currency of the primary economic environment in which the entity operates. Foreign currency transactions are translated into the functional currency using the exchange rates prevailing at the dates of the transactions. Foreign exchange gains and losses resulting from the settlement of such transactions and from the translation at year-end exchange rates of monetary assets and liabilities denominated in foreign currencies are recognized in the income statement, except when deferred in equity as qualifying cash flow hedges.
The consolidated financial statements are presented in Swiss francs (CHF). For consolidation purposes, the results and financial positions of all Group entities whose functional currency differs from the presentation currency are translated into the presentation currency. Assets and liabilities are translated at the closing exchange rate at the date of that balance sheet. Income and expenses are translated at average exchange rates. All resulting conversion differences are recognized in equity.
Foreign exchange differences resulting from intercompany equity loans in a foreign currency are recognized in equity and reversed through profit and loss upon disposal of the entity or upon repayment of the loan.
The preparation of consolidated financial statements requires management to make estimates and judgments that affect the reported amounts of income, expenses, assets, liabilities and the disclosure of contingent assets and liabilities at the date of the financial statements. Therefore, the actual results may differ from these estimates.
The main estimates are in connection with the valuation of the inventory, the determination of useful lives of fixed assets, as well as the capitalization and valuation of deferred tax liabilities and tax assets. All estimates and judgments are continually reviewed and are based on historical experience and other factors, including expectations regarding future events that appear reasonable under the given circumstances.
This chapter comprises the performance and segment information as well as selected income and expense items.
The SFS Group is divided into the three segments: Engineered Components, Fastening Systems and Distribution & Logistics.
As of January 1, 2024, the Industrial and Medical divisions were merged into one new division called Medical & Industrial Specials, which is part of the Engineered Components segment. The Riveting division, which was part of the Fastening Systems segment, was allocated to the Automotive and Medical & Industrial Specials divisions as of January 1, 2024. Therefore the disclosure, monitoring and assessment of the financial results of the former Riveting division will be included in the Engineered Components segment from 2024.
The previous year’s figures were adjusted to the new segment composition for better comparability.
The financial performance of the segments is monitored based on EBIT as well as on operating profit before amortization and depreciation (EBITDA). The segments apply the Group’s accounting policies. Internal transactions are conducted based on internal group rates.
Segment assets are all assets which are directly attributable to a segment, such as receivables, inventories, prepayments and accrued income, property, plant and equipment, intangible assets, as well as deferred tax assets. The segment liabilities include directly attributable payables, accrued liabilities and deferred income, pension benefit obligations, non-current provisions as well as deferred tax liabilities. Financial assets and financial liabilities are not allocated to a segment.
Segment assets less segment liabilities adds up to capital employed. Receivables and inventories deducted by current payables and accrued liabilities add up to working capital. Intercompany transactions, balances, income and expenses between segments are eliminated and reported in the “Corporate” column. In addition to the elimination of intercompany transactions, the “Corporate” segment contains corporate data relating to the Business Support Functions (former Technology, Corporate Services and Corporate IT & Finance).
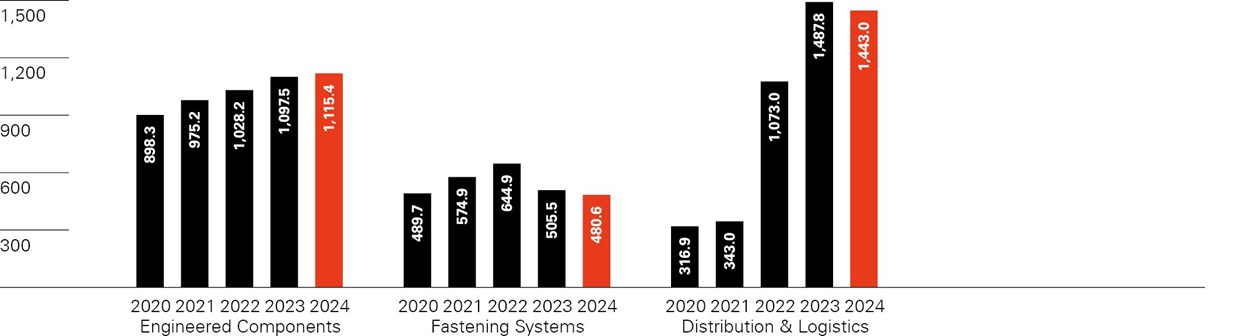
Third–party sales
in CHF million
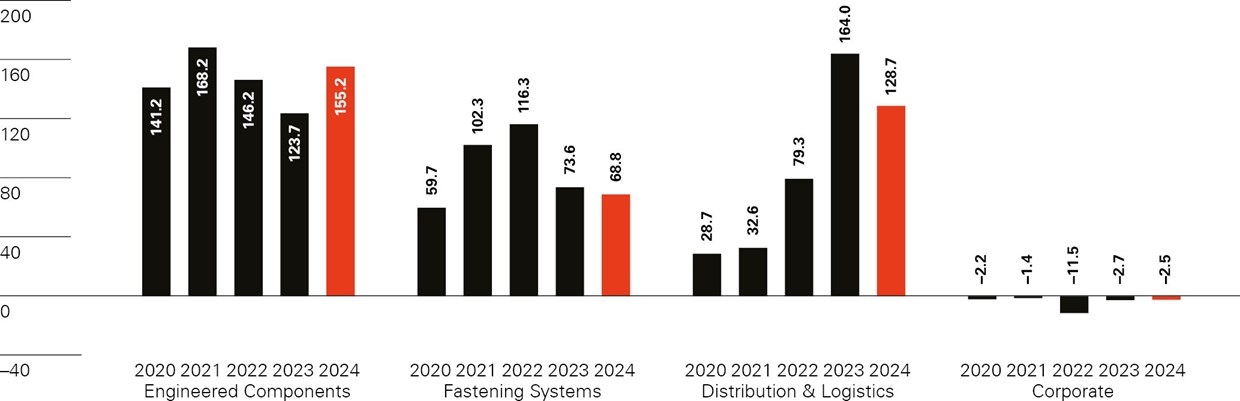
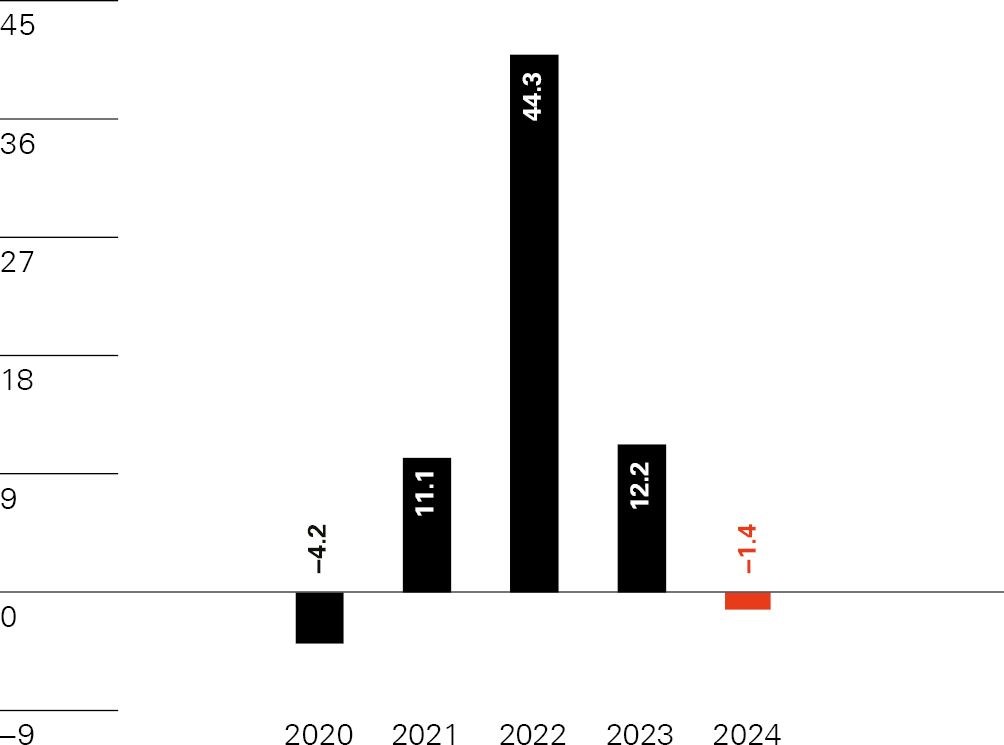
EBIT
in CHF million
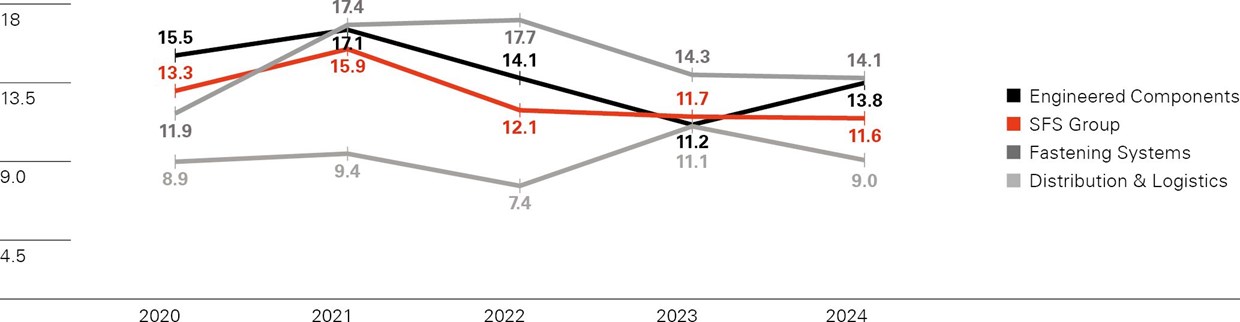
EBIT
in % of net sales
• Fastening Systems: 2020 CHF 2.1 million book gains
• Corporate: 2021 CHF 3.1 million book gains
• Distribution & Logistics: 2022 CHF 22.9 million Amortization of inventory step-up related to purchase price allocation of Hoffmann SE acquisition and first-time intra-segment profit elimination in inventory
2024 | Notes | Engineered Components | Fastening Systems | Distribution & Logistics | Corporate | Total |
Third–party sales | 1,115.4 | 480.6 | 1,443.0 | – | 3,039.0 | |
Change from previous year in % | 1.6 | –4.9 | –3.0 | – | –1.7 | |
Net sales | 1,124.9 | 488.5 | 1,437.1 | –19.4 | 3,031.1 | |
EBITDA | 236.2 | 80.6 | 159.0 | 4.0 | 479.8 | |
in % of net sales | 21.0 | 16.5 | 11.1 | 15.8 | ||
Operating profit (EBIT) | 155.2 | 68.8 | 128.7 | –2.5 | 350.2 | |
in % of net sales | 13.8 | 14.1 | 9.0 | 11.6 | ||
Capital expenditures | 106.1 | 18.5 | 15.4 | 8.9 | 148.9 | |
Operating assets | 1,141.3 | 287.0 | 766.0 | 93.9 | 2,288.2 | |
Operating liabilities | 203.0 | 67.2 | 152.1 | 62.1 | 484.4 | |
Capital employed | 938.3 | 219.8 | 613.9 | 31.8 | 1,803.8 | |
of which net working capital | 296.5 | 124.7 | 326.6 | –10.5 | 737.3 | |
2023 restated1 | Notes | Engineered Components | Fastening Systems | Distribution & Logistics | Corporate | Total |
Third–party sales | 1,097.5 | 505.5 | 1,487.8 | – | 3,090.8 | |
Net sales | 1,102.8 | 515.3 | 1,477.8 | –22.9 | 3,073.0 | |
EBITDA | 203.6 | 84.5 | 193.7 | 4.2 | 486.0 | |
in % of net sales | 18.5 | 16.4 | 13.1 | 15.8 | ||
Operating profit (EBIT) | 123.7 | 73.6 | 164.0 | –2.7 | 358.6 | |
in % of net sales | 11.2 | 14.3 | 11.1 | 11.7 | ||
Capital expenditures | 127.1 | 19.0 | 20.4 | 7.5 | 174.0 | |
Operating assets | 1,072.4 | 274.9 | 792.5 | 80.4 | 2,220.2 | |
Operating liabilities | 202.2 | 61.0 | 169.1 | 59.2 | 491.5 | |
Capital employed | 870.2 | 213.9 | 623.4 | 21.2 | 1,728.7 | |
of which net working capital | 278.0 | 132.7 | 328.1 | –17.9 | 720.9 |
1The previous year’s figures were adjusted to the new segment composition for better comparability.
During the reporting period no customer exceeded the reportable threshold of 10% of third–party sales (PY none).
Sales by region | Notes | 2024 | % | 2023 | % |
Switzerland | 351.4 | 11.6 | 362.5 | 11.7 | |
Germany | 897.3 | 29.5 | 930.3 | 30.1 | |
Other Europe | 857.8 | 28.2 | 892.7 | 28.9 | |
North America | 521.0 | 17.1 | 504.8 | 16.3 | |
China | 256.4 | 8.4 | 265.4 | 8.6 | |
Other Asia | 147.2 | 4.8 | 127.8 | 4.2 | |
Africa, Australia | 7.9 | 0.4 | 7.3 | 0.2 | |
Third–party sales | 3,039.0 | 100.0 | 3,090.8 | 100.0 | |
Not assigned items | –7.9 | –17.8 | |||
Total net sales | 3,031.1 | 3,073.0 |
Gross sales to third parties are allocated to the countries of the receiving party. Not assigned items include invoiced freight, hedged foreign currency fluctuations effects and cash discounts.
Sales by end market | Notes | 2024 | % | 2023 | % |
Automotive industry | 633.7 | 20.9 | 642.2 | 20.8 | |
Construction industry | 616.9 | 20.3 | 644.3 | 20.8 | |
Electrical and electronics industry | 400.0 | 13.1 | 395.1 | 12.8 | |
Industrial manufacturing | 826.9 | 27.2 | 847.1 | 27.4 | |
Medical devices industry | 188.5 | 6.2 | 175.1 | 5.7 | |
Other industries | 373.0 | 12.3 | 387.0 | 12.5 | |
Third–party sales | 3,039.0 | 100.0 | 3,090.8 | 100.0 | |
Not assigned items | –7.9 | –17.8 | |||
Total net sales | 3,031.1 | 3,073.0 |
Reconciliation of segments to income statement and balance sheet
Income statement | Notes | 2024 | 2023 |
Operating profit (EBIT) | 350.2 | 358.6 | |
Financial result | –26.7 | –8.3 | |
Share of profit from associates/joint ventures | 2.8 | 1.9 | |
Earnings before tax | 326.3 | 352.2 |
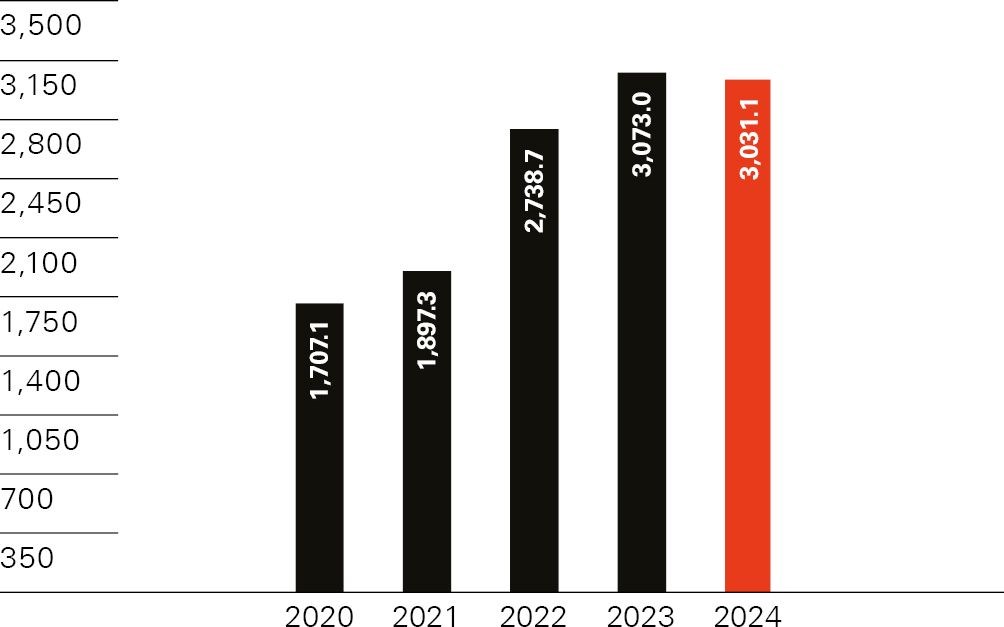
Net sales
in CHF million
Growth of net sales
in %
2024 | 2023 | |
Third–party sales | 3,039.0 | 3,090.8 |
Other items | –7.9 | –17.8 |
Net sales | 3,031.1 | 3,073.0 |
Third–party sales changed by –1.7% (PY 12.6%) compared to previous year. The effect of changes in the scope of consolidation amounts to 0.1% (PY 14.6%). Based on a like-for-like view and ignoring foreign currency effects, sales increased by 0.1% (PY 2.1%). The currency translation effect amounts to –1.9% (PY –4.1%).
Sales does not comprise interests, user fees or dividends.
Sales of goods and services are recognized when the risks and rewards have been transferred to the customer, which is the point of shipping or billing or when services are rendered. Cash discounts and rebates granted to customers are treated as a reduction of sales.
2024 | 2023 | |
Revenue from services | 19.0 | 17.3 |
Lease income | 1.0 | 1.0 |
Own-built machinery and capitalized own work | 11.1 | 11.8 |
Gain on disposals of assets | 1.9 | 3.3 |
Government grants related to income | 2.5 | 4.5 |
Total | 35.5 | 37.9 |
In 2020, the SFS Group started a project for the upgrade of the ERP system to SAP S/4HANA. The project was continued in 2024. A part of the project was completed in 2022 and capitalized in intangible assets, the remaining part of the project is expected to be completed in 2025. The related own work is capitalized.
Government grants related to income are recognized when there is reasonable assurance that the conditions attached to the grant can be fullfilled and the value of the grant can be estimated reliably. The government grants are recognized in the income statement in the periods when the corresponding expenses are recognized. The disclosure of government grants related to income of the previous year was adjusted in accordance with the new recommendations of Swiss GAAP FER 28. In the previous year, government grants related to income in the amount of CHF 4.5 million were included in the disclosure of revenue from services. The cash flow from operating activities of the reporting period includes government grants related to income of CHF 2.3 million (PY CHF 4.5 million).
2024 | 2023 | |
Wages and salaries | 674.2 | 654.5 |
Profit sharing | 9.6 | 9.5 |
Social security expenses | 153.9 | 147.3 |
Other employment expenses | 16.5 | 18.3 |
Total | 854.2 | 829.6 |
In 2024, personnel expenses are reduced by contributions from government support programs worldwide in the amount of CHF 0.5 million (PY CHF 0.0 million).
Share-based payments
The members of the Board of Directors and Group Executive Board receive a variable compensation in the form of shares of SFS Group AG. The shares rewarded must be held for at least three years. The expenses amounting to CHF 1.7 million (PY CHF 1.5 million) of these shares represent the share price on the day they are granted and are charged to the income statement under the line item “Personnel expenses”.
In addition, SFS maintains a share purchase program for selected employees. Usually, every other year shares of SFS Group AG are sold to Board of Directors and key management members as well as specialists at a discount, which is charged to personnel expenses. The last share purchase program took place in 2023.
2024 | 2023 | |
Tools, energy, maintenance | 163.1 | 165.2 |
Selling and distribution | 165.6 | 171.3 |
Other operating expenses | 125.1 | 125.3 |
Total | 453.8 | 461.8 |
Other operating expenses include operating lease expenses amounting to CHF 42.0 million (PY CHF 34.2 million). The total expenses for research and development recognized during the reporting period amount to CHF 76.0 million (PY CHF 60.8 million). The main items responsible for those costs include the fields development, tools, sampling and preparation for large–scale production. They are included in several expense line–items in the income statement.
Development costs are only capitalized in case the future income covers the capitalized amount and if the other criteria required by Swiss GAAP FER are met. The requirements for capitalization according to Swiss GAAP FER have not been met for items in other operating expenses in the current reporting period as well as in the prior year.
2024 | 2023 | |
Interest expenses | –18.8 | –20.1 |
Foreign exchange losses on financial investments | –10.8 | – |
Financial expenses | –29.6 | –20.1 |
Interest income | 2.9 | 1.9 |
Foreign exchange gains on financial investments | – | 9.9 |
Financial income | 2.9 | 11.8 |
Financial result | –26.7 | –8.3 |
Borrowing costs directly attributable to the acquisition, construction or production of qualifying assets, which are assets that necessarily take a substantial period of time to get ready for their intended use, are added to the cost of those assets. All other borrowing costs are recognized in financial expenses in the period in which they incurred.
2024 | 2023 | |
Current income tax expense | 91.5 | 87.5 |
Deferred tax expense (+)/income (–) | –7.9 | –3.8 |
Income taxes | 83.6 | 83.7 |
Reconciliation | ||
Earnings before tax | 326.3 | 352.2 |
Expected tax rate in % | 14.3 | 14.3 |
Expected income tax expense | 46.7 | 50.4 |
Variance in tax rates | 33.2 | 38.4 |
Impact of change in tax rate on deferred taxes | 0.0 | –5.0 |
Items not subject to tax | 3.9 | –1.7 |
Changes in tax loss carryforwards | 2.3 | –0.1 |
Adjustments in respect of prior years and other items | –2.5 | 1.7 |
Income taxes | 83.6 | 83.7 |
Effective tax rate in % | 25.6 | 23.8 |
The income tax expense includes taxes which have been paid and accrued based on the profits of the taxable entities. These are calculated based on the relevant tax rates in the different countries. The reconciliation summarizes the individual reconciliation calculations which have been prepared based on the applicable tax rates of the respective tax jurisdictions. The expected income tax has been calculated based on the future expected tax rate of 14.3% (PY 14.3%) and corresponds to the maximum tax rate for legal entities in the canton of St.Gallen.
In December 2021, the OECD published the Pillar Two model rules to introduce a global minimum tax of 15% for multinational companies with consolidated revenues of more than EUR 750 million. Meanwhile, relevant elements of Pillar Two legislation have been substantively enacted in many jurisdictions in which the SFS Group operates including Switzerland. Such legislation will be effective for the SFS Group’s financial year 2024. Based on the results of 2024, the SFS Group has performed assessments of its potential exposure to Pillar Two income taxes specifically in relation to the so-called Transitional CbCR Safe Harbour tests (TSH tests). According to the information available as of today the SFS Group anticipates fulfilling the TSH tests in all relevant jurisdictions and therefore no material top-up taxes are expected to be due for 2024. The SFS Group continues to monitor the development of the Pillar Two rules and their impact on the group.
“Capital employed” consists of operating assets less operating liabilities. Operating assets include all assets directly attributable to the segments such as receivables, inventories, prepaid expenses, property, plant and equipment, intangible assets and deferred tax assets. Operating liabilities comprise all liabilities directly attributable to the segments such as accrued liabilities, pension benefit obligations, provisions and deferred tax liabilities.
2024 | 2023 | |
From third parties | 472.8 | 463.7 |
From associates/joint ventures | 0.3 | 0.3 |
From related parties | 0.2 | 0.2 |
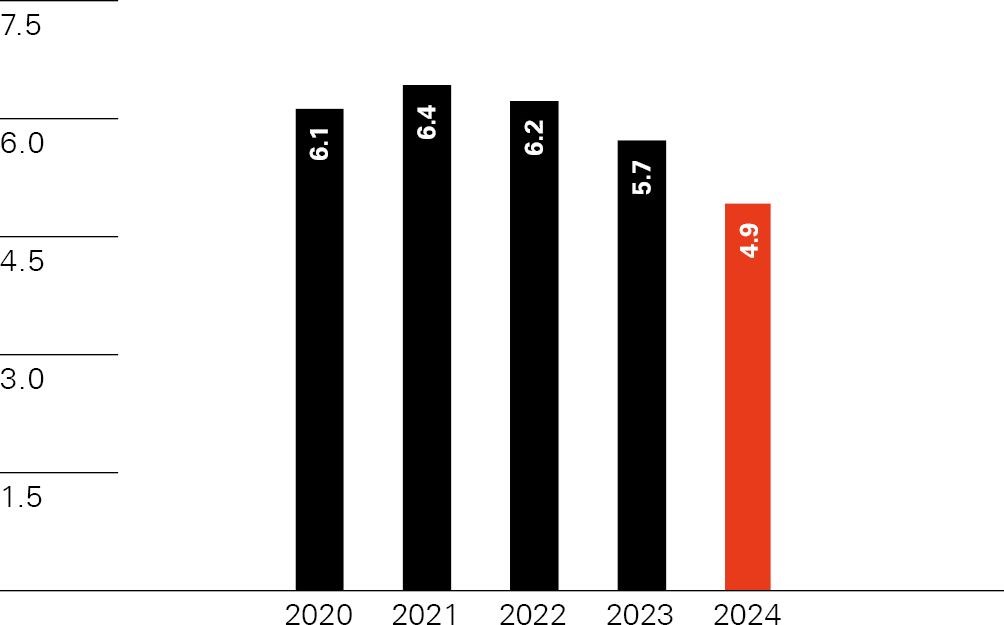
Valuation allowances | –4.9 | –5.7 |
Total | 468.4 | 458.5 |
Aging analysis | 2024 | 2023 |
Not due | 400.0 | 379.4 |
Overdue 1–30 days | 52.2 | 59.0 |
Overdue 31–90 days | 16.4 | 17.9 |
Overdue >91 days | 4.7 | 7.9 |
Trade receivables (gross) | 473.3 | 464.2 |
Valuation allowances | –4.9 | –5.7 |
Trade receivables (net) | 468.4 | 458.5 |
Current receivables are valued at par value. The valuation allowances are determined based on the maturity structure and identifiable credit risks of trade receivables.
2024 | 2023 | |
VAT and withholding tax | 17.1 | 16.8 |
Receivables from supplier rebates | 36.2 | 41.1 |
Other receivables | 26.7 | 26.4 |
Short-term derivative financial instruments | 26.8 | 2.0 |
Total | 106.8 | 86.3 |
2024 | 2023 | |
Raw materials | 56.5 | 55.0 |
Consumables | 12.8 | 11.5 |
Work in progress | 92.9 | 84.1 |
Finished goods incl. trading goods | 476.4 | 485.5 |
Valuation allowances | –86.2 | –85.2 |
Total | 552.4 | 550.9 |
Inventories are generally valued at acquisition cost or at production cost or − if this is lower − at the net realizable value. The cost of goods comprises raw materials, direct labor, other direct costs and related production overheads based on normal operating capacity utilization. Cash discounts from suppliers are deducted from the acquisition costs.
Necessary valuation allowances are based on the individual valuation of single items. The inventory quantity of each item is generally compared to the annual consumption over the last twelve months. The first annual consumption of stock is assessed recoverable by 100%. If the quantity of inventory is higher than annual consumption, the excess inventory for the second annual consumption is written down to 50% of the value. All inventory above two years annual consumption is completely written off. Items added to the product range during the last 18 months prior to the balance sheet date are defined as new products and are not revalued.
In addition, the average sales price less cost to sell is compared to the inventory value of the individual inventory items. If the sales price less cost to sell is lower than the inventory value, a provision in the amount of the difference is recognized and disclosed in the valuation allowances.
Undeveloped property | Land and buildings | Machines and equipment | Assets under construction | Total | |
Cost as at 01/01/2023 | 19.8 | 866.7 | 1,261.4 | 85.0 | 2,232.9 |
Changes in scope of consolidation | – | – | 0.3 | – | 0.3 |
Additions | – | 22.3 | 64.3 | 74.9 | 161.5 |
Disposals | – | –1.3 | –22.7 | – | –24.0 |
Reclassifications | – | 10.7 | 36.7 | –48.6 | –1.2 |
Exchange differences | –0.8 | –35.8 | –61.1 | –4.7 | –102.4 |
Cost as at 12/31/2023 | 19.0 | 862.6 | 1,278.9 | 106.6 | 2,267.1 |
Changes in scope of consolidation | – | 0.1 | 0.9 | – | 1.0 |
Additions | – | 9.6 | 70.7 | 61.0 | 141.3 |
Disposals | – | –2.5 | –23.2 | –0.2 | –25.9 |
Reclassifications | – | 19.2 | 44.3 | –64.2 | –0.7 |
Exchange differences | 0.2 | 16.0 | 31.9 | 3.8 | 51.9 |
Cost as at 12/31/2024 | 19.2 | 905.0 | 1,403.5 | 107.0 | 2,434.7 |
Accumulated depreciation as at 01/01/2023 | – | –393.3 | –838.1 | – | –1,231.4 |
Depreciation | – | –31.1 | –85.9 | – | –117.0 |
Disposals | – | 0.7 | 22.3 | – | 23.0 |
Exchange differences | – | 11.8 | 38.4 | – | 50.2 |
Accumulated depreciation as at 12/31/2023 | – | –411.9 | –863.3 | – | –1,275.2 |
Depreciation | – | –29.9 | –88.0 | – | –117.9 |
Disposals | – | 1.5 | 21.3 | – | 22.8 |
Reclassifications | – | –1.5 | 1.5 | – | – |
Exchange differences | – | –5.7 | –21.5 | – | –27.2 |
Accumulated depreciation as at 12/31/2024 | – | –447.5 | –950.0 | – | –1,397.5 |
Net book value as at 01/01/2023 | 19.8 | 473.3 | 423.4 | 85.0 | 1,001.5 |
Net book value as at 12/31/2023 | 19.0 | 450.7 | 415.6 | 106.6 | 991.9 |
Net book value as at 12/31/2024 | 19.2 | 457.5 | 453.5 | 107.0 | 1,037.2 |
Property, plant and equipment are recognized in the balance sheet at acquisition cost or production cost less depreciation. Value-added expenditures, which lead to an extension of useful life or increased production capacity, are capitalized. Interest expenses incurred when the asset was under construction, are included in the historical costs, if material. Depreciation is calculated using the straight-line method to allocate the cost over the asset’s estimated useful lives, as follows:
Buildings | Years |
Buildings | 20–33 |
Infrastructure | 10–15 |
Machinery and equipment | |
Machinery | 5–15 |
Furniture, fittings and equipment | 5–10 |
Vehicles | 3–8 |
IT hardware | 3–5 |
Based on its unlimited useful life, land is capitalized at acquisition cost and is not depreciated.
The assets are reviewed for impairment whenever events or changes in circumstances indicate that their carrying amount may not be recoverable. An impairment loss is recognized through profit and loss for the amount by which the asset’s carrying amount exceeds its recoverable amount. Government grants related to assets are offset against the acquisition costs of the asset concerned, as long as the SFS Group has no repayment obligation.
Government grants related to assets are offset against the book value of the tangible asset when there is reasonable assurance that the conditions attached to the grant can be fullfilled and the value of the grant can be estimated reliably.
The book value of assets under construction includes down payments to suppliers of CHF 29.2 million (PY CHF 26.9 million).
In order to collateralize borrowings, assets amounting to CHF 72.3 million (PY CHF 60.5 million) have been pledged with CHF 66.1 million (PY CHF 42.3 million), of which CHF 32.2 million (PY CHF 38.7 million) have been drawn.
The financial commitments for contracted purchases of property, plant and equipment as well as for assets under construction amount to CHF 74.2 million (PY CHF 86.8 million).
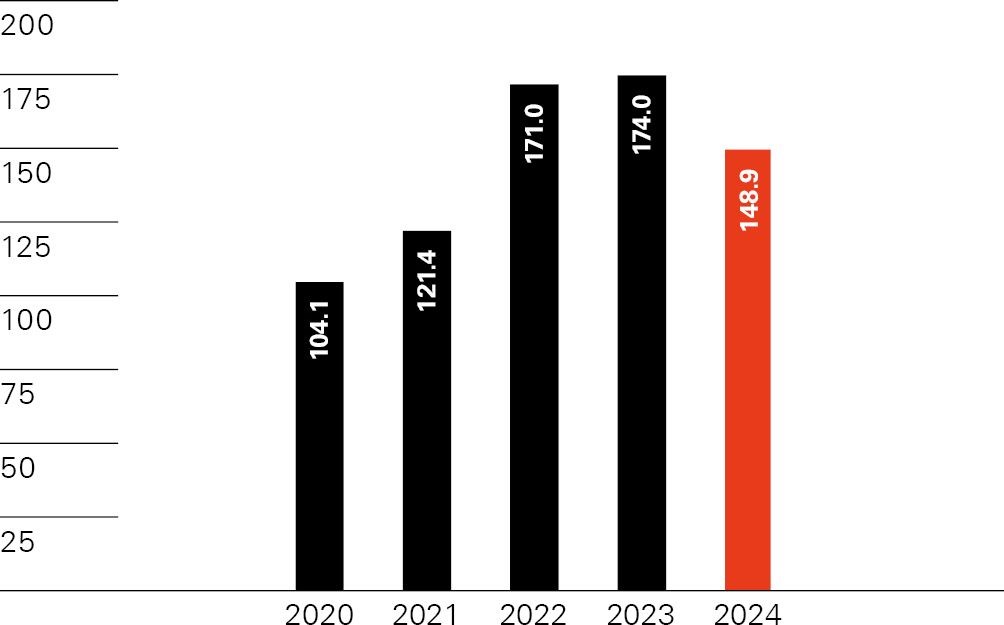
The following charts show the additions to property, plant and equipment as well as intangible assets from the notes 3.4 and 3.5.
Additions property, plant and equipment and intangible assets
in CHF million
Additions property, plant and equipment and intangible assets
in % net sales
Customer relationships, brands, technology | Software | Software in development | Building rights, patents and other intangible assets | Total | |
Cost as at 01/01/2023 | – | 103.7 | 16.2 | 14.7 | 134.6 |
Additions | – | 3.8 | 3.8 | 4.9 | 12.5 |
Disposals | – | –0.3 | – | 0.0 | –0.3 |
Reclassifications | – | 4.8 | – | – | 4.8 |
Exchange differences | – | –1.6 | – | –1.3 | –2.9 |
Cost as at 12/31/2023 | – | 110.4 | 20.0 | 18.3 | 148.7 |
Changes in scope of consolidation | 8.6 | 0.0 | – | 0.0 | 8.6 |
Additions | – | 2.0 | 5.2 | 0.4 | 7.6 |
Disposals | – | –39.2 | – | 0.0 | –39.2 |
Reclassifications | – | 0.7 | – | – | 0.7 |
Exchange differences | 0.1 | 0.6 | – | 0.5 | 1.2 |
Cost as at 12/31/2024 | 8.7 | 74.5 | 25.2 | 19.2 | 127.6 |
Accumulated amortization as at 01/01/2023 | – | –74.8 | – | –2.1 | –76.9 |
Amortization | – | –6.7 | – | –3.7 | –10.4 |
Disposals | – | 0.3 | – | 0.0 | 0.3 |
Reclassifications | – | –3.7 | – | – | –3.7 |
Exchange differences | – | 1.0 | – | 0.4 | 1.4 |
Accumulated amortization as at 12/31/2023 | – | –83.9 | – | –5.4 | –89.3 |
Amortization | –0.5 | –7.2 | – | –4.0 | –11.7 |
Disposals | – | 39.2 | – | 0.0 | 39.2 |
Exchange differences | 0.0 | –0.4 | – | –0.1 | –0.5 |
Accumulated amortization as at 12/31/2024 | –0.5 | –52.3 | – | –9.5 | –62.3 |
Net book value as at 01/01/2023 | – | 28.9 | 16.2 | 12.6 | 57.7 |
Net book value as at 12/31/2023 | – | 26.5 | 20.0 | 12.9 | 59.4 |
Net book value as at 12/31/2024 | 8.2 | 22.2 | 25.2 | 9.7 | 65.3 |
Intangible assets generated internally | – | 4.7 | 14.5 | – | 19.2 |
Purchased intangible assets | 8.2 | 17.5 | 10.7 | 9.7 | 46.1 |
Intangible assets are recognized in the balance sheet at acquisition cost or production cost less accumulated amortization. Amortization is calculated using the straight-line method to allocate the costs over the assets’ estimated useful lives, as follows:
Intangible assets | Years |
Customer relationships, brands, technology | 3–5 |
Software | 3–10 |
Building rights (maximum) | 50 |
Patents | 3–5 |
Other intangible assets | 5 |
Intangible assets generated internally can only be recognized as an asset if they meet all of the following conditions at the time of the initial recognition: They are identifiable, controlled by SFS, they will yield a measurable benefit over several years, expenses can be recognized and measured separately and it is likely that the resources needed to complete the intangible assets are available or will be made available.
Government grants related to assets are offset against the book value of the intangible asset when there is reasonable assurance that the conditions attached to the grant can be fullfilled and the value of the grant can be estimated reliably.
The intangible assets are reviewed for impairment whenever events or changes in circumstances indicate that the carrying amount may not be recoverable. An impairment loss is recognized through profit and loss for the amount by which the asset’s carrying amount exceeds its recoverable amount.
The financial commitments for contracted intangible assets amount to CHF 0.9 million (PY CHF 2.1 million) in 2024.
Goodwill related to acquisitions is offset against equity at acquisition date. The effects of theoretical capitalization and amortization over five years are shown in the table below. If a contract is concluded, transaction costs are part of the acquisition costs. Earnout payments are offset against equity as well. As goodwill is immediately offset against equity at acquisition date, an impairment of goodwill would not impact the income statement, but the theoretical impact would be shown in the theoretical statement of changes in goodwill.
2024 | 2023 | |
Balance as at 01/01 | 554.4 | 584.7 |
Acquisitions | 7.6 | 8.9 |
Derecognition | –123.1 | – |
Exchange differences | 33.5 | –39.2 |
Balance as at 12/31 | 472.4 | 554.4 |
Accumulated amortization 01/01 | –252.9 | –158.6 |
Amortization | –100.2 | –112.1 |
Derecognition | 123.1 | – |
Exchange differences | –24.9 | 17.8 |
Accumulated amortization 12/31 | –254.9 | –252.9 |
Theoretical value of goodwill as at 12/31 | 217.5 | 301.5 |
Equity according to balance sheet | 1,559.2 | 1,375.7 |
Theoretical value of goodwill | 217.5 | 301.5 |
Theoretical shareholders’ equity as at 12/31 | 1,776.7 | 1,677.2 |
Net income | 242.7 | 268.5 |
Amortization of goodwill | –100.2 | –112.1 |
Theoretical net income | 142.5 | 156.4 |
Theoretical goodwill is derecognized in the table above as soon as it is fully amortized.
2024 | 2023 | |
Against third parties | 167.9 | 186.8 |
Against related parties | 0.1 | 0.1 |
Total | 168.0 | 186.9 |
Trade payables are recognized in the balance sheet at par value.
2024 | 2023 | |
VAT and other liabilities | 48.9 | 52.0 |
Tax liabilities | 50.7 | 40.5 |
Short-term derivative financial instruments | 1.4 | – |
Total | 101.0 | 92.5 |
SFS Group maintains pension plans in several countries. The pension plans are mostly legal entities or foundations that are financially independent from the SFS Group. They are compliant with local requirements and the employees and SFS usually fund the plans in equal parts.
The economic impact of the pension plans on the SFS Group is reassessed annually. The valuation of a surplus or deficit is based on the plan’s financial statement in accordance with Swiss GAAP FER 26 (Swiss plans) or based on an established method in the respective jurisdiction (non-Swiss plans). In the case of a surplus, an economic benefit exists if it is permitted and intended to use the surplus to decrease the employer contributions, to reimburse it to the employer based on local law or to use it beyond the statutory benefits for another economic benefit of the employer. Surpluses which the SFS Group can use as contributions at any time are recognized as assets in the SFS Group’s balance sheet. In the case of a deficit, an economic obligation exists if the conditions for recognizing a provision are met. The change from the previous year in economic benefit and economic obligation is recognized (together with the expenses relating to the business period) as personnel expenses in the result of the period.
Swiss plans
Employees of the SFS Group in Switzerland are insured against the risks of old age, death and disability with the SFS Pension Fund based on the Federal Law on Occupational Retirement, Survivors’, and Disability Pension Plans (OPA). The SFS Pension Fund is a foundation which is legally separated from the SFS Group. As per December 31, 2024, the SFS Pension Fund has an expected coverage ratio according to the OPA 117.5% (PY 111.2%). The pension liabilities and actuarial reserves are calculated based on a technical interest rate of 1.75% (PY 1.5%) using the life expectancy table BVG 2020 (PY BVG 2020). In order to ensure the financial stability of the Fund, the trustees of the SFS Pension Fund decided to reduce the conversion rate gradually to 5.2% until 2024 and not to further reduce the rate for the time being. The determination of the economic impact on the SFS Group is based on the preliminary financial statements of the SFS Pension Fund and the Patronage Fund.
Non-Swiss plans
For non-Swiss plans, external actuarial reports are used to determine the economic impact on the SFS Group. Depending on the mix of insured persons (employees, retirees), the present value of benefit obligations is calculated using an interest rate of 3.2% to 5.6% (PY 3.1% to 4.7%).
Employer contribution reserve (ECR) | Nominal value | Waiver of use | Balance sheet | Accumulation | Balance sheet | Result from ECR in personnel expenses | |
12/31/2024 | 2024 | 12/31/2024 | 2024 | 12/31/2023 | 2024 | 2023 | |
Patronage Fund | 22.8 | – | 22.8 | 1.4 | 21.4 | –1.4 | –0.7 |
SFS Pension Fund | 1.5 | – | 1.5 | 0.1 | 1.4 | –0.1 | –0.0 |
Total | 24.3 | – | 24.3 | 1.5 | 22.8 | –1.5 | –0.7 |
An economic benefit is capitalized in the SFS Group’s balance sheet coming from uncommitted employer contribution reserves as well as from the Patronage fund’s non-committed funds. It is intended to use the surplus to decrease the employer contributions.
Economic benefit/economic obligation and pension benefit expenses | Surplus/deficit | Economic share of the entity | +/– | Contribution concerning | Pension benefit expenses within personnel expenses | ||
12/31/2024 | 12/31/2024 | 12/31/2023 | 2024 | 2024 | 2023 | ||
Patronage Fund | 1.5 | 1.5 | 2.0 | –0.5 | – | 0.5 | –2.0 |
Pension Funds | |||||||
without surplus/deficit | – | – | – | – | 33.8 | 33.8 | 32.7 |
with deficit | –2.9 | –2.9 | –2.6 | –0.3 | – | 0.2 | –0.1 |
without own assets | –9.2 | –9.2 | –9.4 | 0.2 | – | –0.3 | –0.5 |
Total | –10.6 | –10.6 | –10.0 | –0.6 | 33.8 | 34.2 | 30.1 |
Pension Funds “without surplus/deficit” include the SFS Pension Fund. At balance sheet date, no non-committed funds exist. Therefore, neither an economic benefit nor an economic obligation is capitalized in the SFS Group’s balance sheet. Furthermore, foreign contribution-based plans are included in this category.
Pension Funds “with deficit” include plans of which benefit obligations exceed the plan’s assets. As of December 31, 2024, this is the case for one plan in Germany (PY one) and one plan in France (PY one).
Pension Funds “without own assets” include five plans in Germany (PY five), one plan in France (PY one), one plan in Italy (PY one) and one plan in Mexico (PY one). The economic obligations of these plans are recognized in SFS Group’s balance sheet as provisions if the conditions for recognizing a provision are met.
Anniversaries, severance payments | Other provisions | Total | |
Balance as at 01/01/2023 | 9.1 | 6.3 | 15.4 |
Additions | 1.7 | 0.3 | 2.0 |
Used amounts | –1.1 | –0.1 | –1.2 |
Unused amounts reversed | –0.3 | –0.7 | –1.0 |
Exchange differences | –0.8 | –0.2 | –1.0 |
Balance as at 12/31/2023 | 8.6 | 5.6 | 14.2 |
Additions | 2.8 | 0.5 | 3.3 |
Used amounts | –1.1 | –0.2 | –1.3 |
Unused amounts reversed | –1.5 | –1.3 | –2.8 |
Exchange differences | –0.2 | 0.1 | –0.1 |
Balance as at 12/31/2024 | 8.6 | 4.7 | 13.3 |
of which non-current | 8.6 | 4.7 | 13.3 |
Various countries are obliged to recognize provisions as the employees are entitled to receive severance payments following the termination of employment. These provisions are disclosed in the “Anniversaries, severance payments” column. The “Other provisions” column contains provisions for warranty claims and business risks. Obligations arising from product liability are covered by the SFS Group’s insurance policies. Provisions for warranty claims are recognized based on historical experience and amount to CHF 2.4 million (PY CHF 2.3 million). Provisions for specific business risks amount to CHF 2.3 million (PY CHF 3.3 million).
A provision is recognized when the SFS Group has a present legal or constructive obligation as a result of past events, the outflow of resources becomes probable and the amount of the outflow can be estimated reliably. The valuation of provisions is based on the SFS Group’s best estimate at the balance sheet date.
Net deferred tax balances | 12/31/2024 | 12/31/2023 |
Deferred tax assets | –52.9 | –43.8 |
Deferred tax liabilities | 63.5 | 61.1 |
Total | 10.6 | 17.3 |
Movement in net deferred tax balances | 2024 | 2023 |
Balance as at 01/01 | 17.3 | 19.4 |
Changes in scope of consolidation | 2.0 | –0.3 |
Charged (+)/credited (–) to income statement | –7.9 | –3.8 |
Charged (+)/credited (–) to equity | –0.2 | 0.1 |
Exchange differences | –0.6 | 1.9 |
Balance as at 12/31 | 10.6 | 17.3 |
Current tax liabilities arising from the taxable profit of the reporting period are accrued for, irrespective of when they are due for payment. Deferred tax assets and liabilities are recognized on all temporary differences arising between the carrying amount of an asset or liability in the statement of financial position according to Swiss GAAP FER and its tax base.
The deferred taxes are determined using local tax rates that have been enacted by the balance sheet date and are expected to apply when the deferred tax items are realized or settled. Deferred tax liabilities arising from future distribution of retained earnings are not recognized when the Group is able to control the timing and a reversal of the temporary difference is unlikely.
SFS does not recognize deferred tax assets and liabilities in relation to Pillar Two income taxes.
The table below shows the tax loss carryforwards:
Recognized | Unrecognized | |||
Tax loss carryforwards | 2024 | 2023 | 2024 | 2023 |
Expiry in <3 years | 1.2 | 2.0 | 5.3 | – |
Expiry within 3–7 years | 2.6 | 1.3 | 3.3 | 4.3 |
Expiry in >7 years | 2.1 | 5.2 | 26.1 | 28.3 |
Total | 5.9 | 8.5 | 34.7 | 32.6 |
Deferred tax assets are recognized for tax loss carryforwards and on other temporary differences to the extent that is expected to be realizable within the next five years. In this context, in 2024, deferred tax assets on temporary differences in the amount of CHF 9.9 million (PY CHF 12.1 million) were not recognized in these consolidated financial statements.
This chapter describes the management of the capital structure and its financial risks. The aim is to optimize profits in relation to equity plus net debt, to secure liquidity and to minimize currency risks.
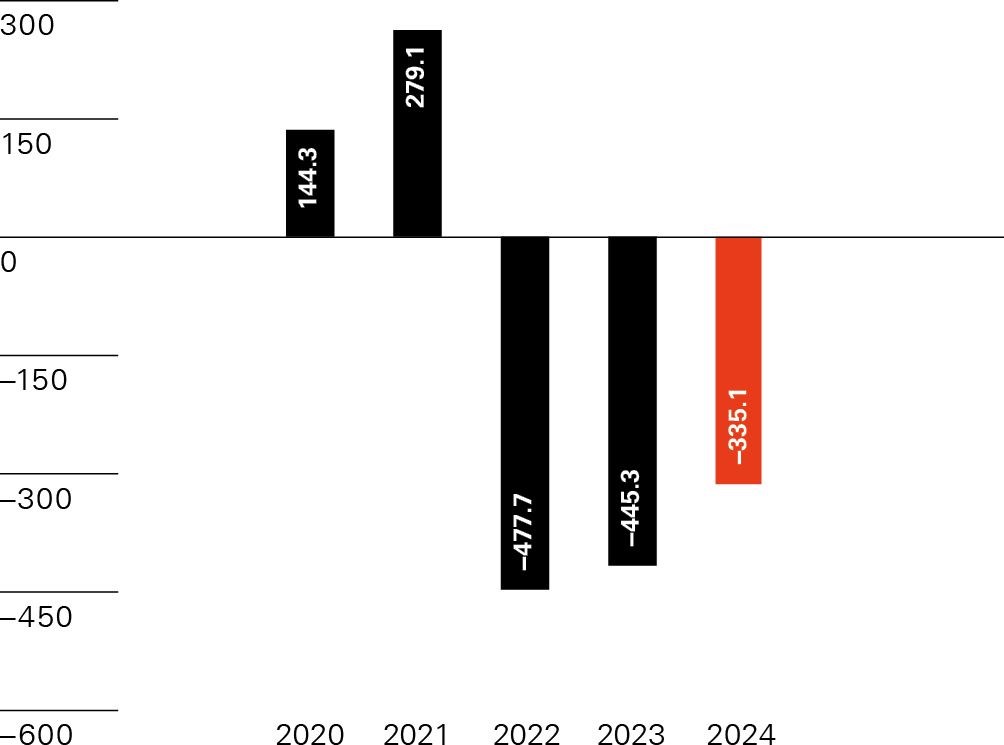
Net cash (+)/debt (–)
in CHF million
2024 | 2023 | |
Cash at bank and on hand | 163.2 | 164.5 |
Current bank deposits | 61.4 | 63.0 |
Total | 224.6 | 227.5 |
Cash and cash equivalents include cash on hand, deposits held on call with banks and other short-term highly liquid investments. Due to the short-term maturities of the cash equivalents, the carrying amount is equal to the fair value of these assets. In order to qualify as a cash equivalent, the original maturity of the instrument must be 90 days or less.
2024 | 2023 | |
Loans to third parties | 4.3 | 4.1 |
Investments | 18.5 | 14.8 |
Assets from employer contribution reserves | 24.3 | 22.8 |
Economic benefit from pension plans | 1.5 | 2.0 |
Derivative financial instruments | 20.4 | 50.3 |
Other financial assets | 3.6 | 3.0 |
Total | 72.6 | 97.0 |
Marketable securities and financial assets are measured at market value, if available, and non-realized gains and losses are recognized through profit or loss. In absence of a market value, marketable securities and financial assets are measured at acquisitions costs less any impairment. Investments include investments in associates, joint ventures and immaterial subsidiaries which are not included in the scope of consolidation.
In connection with the financing of the Hoffmann SE acquisition and the corresponding issuance of two bonds with a volume of CHF 400 million (refer to note 4.3), the SFS Group has entered into two cross-currency swaps (CHF/EUR) with the same volume and maturity (refer to note 4.7). The cross-currency swaps (designated as hedging instruments) are used to hedge the foreign currency exposure which arises from the translation of net investments in foreign entities (designated as hedged items) into the Group’s presentation currency. Changes in the fair values of the cross-currency swaps (net investment hedges) are recognized in equity and reversed through profit and loss upon disposal of the entity. As of December 31, 2024, the fair values of the cross-currency swaps amount to CHF 47.2 million, thereof CHF 26.8 million are disclosed as other current receivables and CHF 20.4 million are disclosed as financial assets (fair values December 31, 2023: CHF 50.3 million).
2024 | 2024 Interest rate in % | 2023 | 2023 Interest rate in % | |
Bonds | 250.0 | See below | – | – |
Bank borrowings | 26.0 | 4.0 | 20.9 | 4.0 |
Current borrowings from third parties | 0.0 | 0.0 | 15.8 | 4.4 |
Current borrowings | 276.0 | 1.3 | 36.7 | 4.2 |
of which CHF | 250.0 | 1.0 | – | – |
of which EUR | 9.7 | 1.7 | 24.1 | 3.1 |
of which USD | 16.3 | 5.4 | 12.6 | 6.3 |
Bonds | 150.0 | See below | 400.0 | See below |
Bank borrowings | 119.6 | 2.7 | 223.0 | 3.8 |
Non-current borrowings from third parties | 14.0 | 3.6 | 13.1 | 1.2 |
Non-current borrowings | 283.6 | 2.1 | 636.1 | 2.2 |
of which CHF | 150.0 | 1.5 | 400.0 | 1.2 |
of which EUR | 133.4 | 2.8 | 236.1 | 3.9 |
of which USD | 0.2 | 8.7 | – | – |
of which other currencies | 0.0 | 0.0 | 0.0 | 0.0 |
Total borrowings | 559.6 | 1.7 | 672.8 | 2.3 |
Bonds | |||
Nominal value in CHF million | Interest rate in % | Term | Expiration at nominal value |
250.0 | 1.00 | 2022–2025 | 06/06/2025 |
150.0 | 1.45 | 2022–2027 | 06/08/2027 |
In connection with the financing of the Hoffmann SE acquisition, the SFS Group issued two bonds with a volume of CHF 400 million in June 2022. Bonds are recognized in the balance sheet at par value. Deviations from the par value in the case of below or above-par issues are offset with the emission costs and recognized as accruals and deferrals and afterwards reversed on a straight-line basis over the term of the bonds.
The financial liabilities have the following maturities:
Cash outflows | in <3 months | in 4–12 months | in 13–24 months | in >24 months | Total |
Borrowings | 19.7 | 256.3 | 9.0 | 274.6 | 559.6 |
Interest payments | 2.3 | 5.0 | 5.9 | 9.8 | 23.0 |
Total 12/31/2024 | 22.0 | 261.3 | 14.9 | 284.4 | 582.6 |
Cash outflows | in <3 months | in 4–12 months | in 13–24 months | in >24 months | Total |
Borrowings | 6.4 | 30.3 | 258.2 | 377.9 | 672.8 |
Interest payments | 3.8 | 11.1 | 12.4 | 23.1 | 50.4 |
Total 12/31/2023 | 10.2 | 41.4 | 270.6 | 401.0 | 723.2 |
Syndicated loan
A loan contract was negotiated with five banks in August 2014. Due to the acquisition of Hoffmann SE in 2022, the existing syndicated loan contract was prematurely renewed and two additional banks were included in the syndicate. After exercise of the second extension option, the contract term is still five years and ends on May 10, 2029. The committed and uncollateralized revolving credit line amounts to CHF 600 million until May 10, 2028 and is used to 15.7% (PY 31.6%) at the end of 2024. It may be increased by a maximum amount of an additional CHF 100 million, provided the lenders agree to the request of the SFS Group. This option can be used up to three months before the final maturity date.
The syndicated loan includes normal commercial terms and conditions. The variable interest yield is linked to the financial key ratio “leverage ratio”. The smaller this key ratio, the lower the interest margin. The financial covenant has been met in all subsequent periods:
Threshold | |
Leverage Ratio: Net senior debt/EBITDA | maximum 2.50× |
Finance leases are capitalized at the start of the lease at the lower of the fair value of the leased asset and the present value of the minimum lease payments. They are amortized over the period of the lease. The related leasing obligations are recognized as liabilities. In the reporting period as well as in the previous year, no material finance leases existed.
Lease payments from operating leases are recognized through profit or loss during the period of the lease. If a contract is terminated early, a provision is made for the full amount owed less income realized from subleasing.
Future aggregate minimum lease payments | 2024 | 2023 |
Due <1 year | 45.7 | 39.8 |
Due between 1–5 years | 115.5 | 91.0 |
Due >5 years | 173.5 | 193.5 |
Total | 334.7 | 324.3 |
2024 | 2023 | |
Debt guarantees | 0.7 | 0.2 |
Guarantee obligations | 8.4 | 11.1 |
Other non-recognizable commitments | 341.2 | 325.7 |
Total | 350.3 | 337.0 |
Off-balance sheet transactions consist mainly of debt guarantees, guarantee obligations, liens in favor of third parties and long-term rental contracts. Intercompany items are eliminated. Off-balance sheet transactions are assessed on the basis of the likelihood and the amount of the potential future liabilities and are disclosed above.
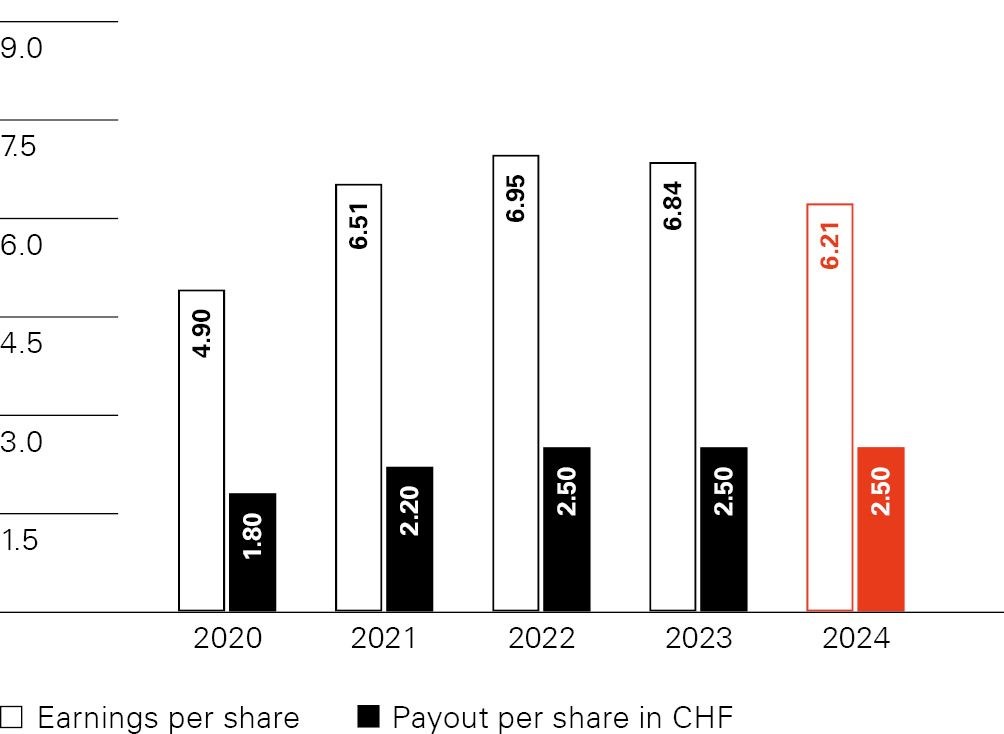
Earnings and payout per share
in CHF
Payout
in %, in CHF million
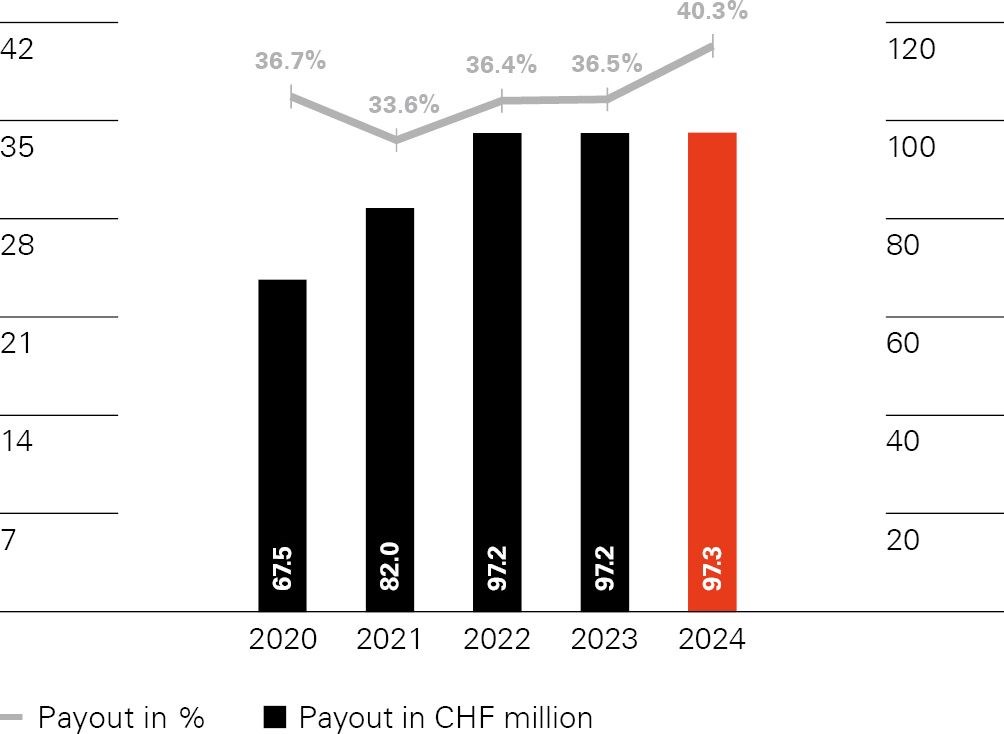
A payout for the financial year 2024 of CHF 2.50 (PY CHF 2.50) per registered share, amounting to a total of CHF 97.3 million (PY CHF 97.3 million), will be proposed at the Annual General Meeting of SFS Group AG on April 30, 2025. The payout from retained earnings and the statutory capital reserve will be realized and accounted in the books after the approval of the Annual General Meeting.
2024 | 2023 | |
Weighted average number of outstanding shares | 38,883,033 | 38,886,854 |
Net income attributable to SFS shareholders | 241.3 | 266.0 |
Earnings per share in CHF basic and diluted | 6.21 | 6.84 |
As of December 31, 2024, 38,900,000 (PY 38,900,000) registered shares at CHF 0.10 are issued and outstanding. The earnings per share are the result of dividing net income entitled to the owners of the SFS Group by the weighted average number of shares in issue and outstanding during the year. As of balance sheet date there exists no capital band (PY none) and no conditional capital (PY none). There are no dilutive effects (PY none). Statutory and legal reserves that may not be distributed amount to CHF 75.3 million (PY CHF 65.7 million) as of December 31, 2024.
Share capital and treasury shares
Quantity | Transaction price (Ø) in CHF | Purchase cost (Ø) in CHF million | |
Balance as at 01/01/2023 | 12,828 | 119.0 | 1.5 |
Purchases | 25,000 | 102.0 | 2.6 |
Sale | –24,422 | 106.0 | –2.7 |
Balance as at 12/31/2023 | 13,406 | 102.0 | 1.4 |
Purchases | 33,500 | 120.8 | 4.0 |
Sale | –12,499 | 110.4 | –1.3 |
Balance as at 12/31/2024 | 34,407 | 120.3 | 4.1 |
The share capital of SFS Group AG constitutes the share capital of the SFS Group. The consideration paid for treasury shares is deducted from the equity and separately disclosed. The profit or loss realized by sales of treasury shares are recognized as a reduction of capital reserves, net of any related income taxes. As of December 31, 2024, the SFS Group companies hold 34,407 shares (PY 13,406) and the SFS Pension Fund and SFS Patronage Fund hold 4,025 shares (PY 2,550) in SFS Group AG.
There exist no obligations to repurchase treasury shares disposed of.
Forward foreign exchange contracts 2024 | Contract value | Market value | ||||
CHF | EUR | USD | CNY | JPY | CHF | |
EUR sale/CHF purchase | 41.1 | –44.2 | –0.2 | |||
USD sale/CNY purchase | –36.9 | 260.1 | –1.0 | |||
USD sale/JPY purchase | –0.2 | 27.7 | 0.0 | |||
Other derivative financial instruments 2024 | ||||||
Cross-currency swap EUR sale/CHF purchase | 250.0 | –238.4 | 26.8 | |||
Cross-currency swap EUR sale/CHF purchase | 150.0 | –143.0 | 20.4 | |||
Forward foreign exchange contracts 2023 | Contract value | Market value | ||||
CHF | EUR | USD | CNY | JPY | CHF | |
EUR sale/CHF purchase | 54.1 | –57.1 | 1.7 | |||
CHF sale/EUR purchase (FX-Swap) | –2.1 | 2.2 | 0.0 | |||
USD sale/CHF purchase | 14.4 | –16.8 | 0.5 | |||
USD sale/CNY purchase | –39.8 | 277.8 | –0.2 | |||
Other derivative financial instruments 2023 | ||||||
Cross-currency swap EUR sale/CHF purchase | 250.0 | –238.4 | 30.5 | |||
Cross-currency swap EUR sale/CHF purchase | 150.0 | –143.0 | 19.8 | |||
The SFS Group uses derivative financial instruments to reduce the risks from interest and foreign currency fluctuations on business and financial transactions. To hedge foreign currency exposures, usually cash flow hedges are used. To reduce volatility in the income statement, changes in the fair value of derivatives are recognized in equity. Amounts accumulated in equity are reclassified to the income statement in the periods when the hedged item affects the income statement or the future cash flow is no longer expected to occur. Derivatives in the current and previous financial year were exclusively held for the purpose of currency hedging.
The SFS Group also uses derivative financial instruments to hedge the foreign currency exposure which arises from the translation of net investments in foreign entities (designated as hedged items) into the Group’s presentation currency. Changes in the fair values of the net investment hedges are recognized in equity and reversed through profit and loss upon disposal of the entity. In connection with the financing of the Hoffmann SE acquisition in 2022 and the corresponding issuance of two bonds with a volume of CHF 400 million (refer to note 4.3), the SFS Group has entered into two cross-currency swaps (CHF/EUR) with the same volume and maturity as the bonds. These cross-currency swaps (designated as hedging instruments) are used to hedge the foreign currency exposure which arises from the translation of net investments in foreign entities (designated as hedged items) into the Group’s presentation currency.
Balance sheet | Income statement | ||||
Unit | 2024 | 2023 | 2024 | 2023 | |
China | CNY 100 | 12.411 | 11.795 | 12.235 | 12.702 |
EU | EUR 1 | 0.941 | 0.926 | 0.953 | 0.972 |
United Kingdom | GBP 1 | 1.135 | 1.066 | 1.125 | 1.117 |
USA | USD 1 | 0.906 | 0.838 | 0.881 | 0.899 |
This chapter provides an overview of the Group structure. Changes and related detailed information are explained. Transactions with related parties are also disclosed.
Acquisition of subsidiaries | 2024 | 2023 |
Cash and cash equivalents | 5.0 | – |
Trade receivables | 3.6 | – |
Inventories | 3.5 | 1.0 |
Other current assets | 0.1 | – |
Property, plant and equipment | 1.0 | 0.3 |
Intangible assets | 8.6 | – |
Other non-current assets | 0.1 | 0.2 |
Current liabilities | –3.6 | –0.1 |
Non-current liabilities | –2.7 | – |
Acquired net assets | 15.6 | 1.4 |
Goodwill offset against equity | 7.6 | 8.9 |
Purchase price incl. acquisition cost | 23.2 | 10.3 |
Cash and cash equivalents acquired | –5.0 | – |
Deferred and other non-cash consideration | –1.0 | – |
Contingent consideration (earnout) | –0.1 | – |
Consideration in cash flow statement | 17.1 | 10.3 |
2024
As of May 1, 2024, the SFS Group acquired Etanco S.A.U., a Spanish distributor of fasteners, fixings, and accessories to the building envelope. The acquisition of Etanco, domiciled in Madrid (ES), strengthens the market position of the Fastening Systems segment of SFS in Spain and Portugal. In 2024, Etanco generated net sales of CHF 2.9 million, of which CHF 1.6 million were included in the consolidated income statement. Contract clauses do not include any contingent consideration (earnout).
As of October 1, 2024, the SFS Group acquired 100% of EPRO D.O.O., a leading, longtime distribution partner for high-end applications to the building envelope in Slovenia. EPRO is part of the Fastening Systems segment. In 2024, the company, domiciled in Ljubljana (SI), generated net sales of CHF 3.6 million, of which CHF 0.9 million were included in the consolidated income statement. Contract clauses do include a contingent consideration (earnout) depending on the EBIT achieved in 2025.
As of November 1, 2024, the SFS Group acquired Pro Fastening Systems Inc. (PFS). The company is an established specialist distributor of fasteners and sealants for the commercial and industrial construction industries. PFS is part of the Fastening Systems segment. In 2024, the company domiciled in Arlington Heights (US) generated net sales of CHF 24.1 million, of which CHF 3.0 million were included in the consolidated income statement. Contract clauses do not include any contingent consideration (earnout).
2023
As of July 1, 2023, the assets of the business concerning fasteners and other products of Connective Systems & Supply, Inc. (CSS) were acquired in an asset deal. In organizational terms, this business unit of the company based in Denver (US) was incorporated into Triangle Fastener Corporation (TFC). This business unit of CSS generated sales of USD 15 million in 2022 with around 20 employees. Contract clauses do not include any contingent consideration (earnout).
Subsidiaries
Participation in % | Share capital in local currency 1,000 | ||||||
Country | Registered office | Name of the company | 2024 | 2023 | Currency | Activities | |
Belgium | Borne (NL) | Hoffmann Quality Tools B.V. | 100.0 | 100.0 | EUR | n/a | V |
Kapellen | SFS Group Belgium B.V. | 100.0 | – | EUR | 20 | V | |
China | Nantong | Unisteel Technology (China) Co., Ltd. | 100.0 | 100.0 | CNY | 796,293 | V, P |
Shanghai | SFS Group (Shanghai) Co., Ltd. | 100.0 | 100.0 | CNY | 708 | DL | |
Hoffmann Quality Tools Trading Co., Ltd. | 100.0 | 100.0 | CNY | 77,069 | V | ||
Costa Rica | La Aurora Heredia | Tegra Medical Costa Rica S.A. | 100.0 | 100.0 | CRC | 1 | V, P |
Germany | Achim | Hoffmann GmbH | 100.0 | 100.0 | EUR | 512 | V |
Essen | Hoffmann Essen Qualitätswerkzeuge GmbH | 100.0 | 100.0 | EUR | 100 | V | |
Frankfurt | Atrium 296. Europäische VV SE | 100.0 | – | EUR | 120 | V | |
Göppingen | Hoffmann Göppingen Qualitätswerkzeuge GmbH | 100.0 | 100.0 | EUR | 30 | V | |
Munich | Hoffmann Auslands-Beteiligungs GmbH | 100.0 | 100.0 | EUR | 25 | H | |
Hoffmann Engineering Services GmbH | 100.0 | 100.0 | EUR | 25 | DL | ||
Hoffmann Group Immobilien GmbH | 100.0 | 100.0 | EUR | 25 | DL | ||
Hoffmann GmbH Qualitätswerkzeuge | 100.0 | 100.0 | EUR | 512 | V | ||
Hoffmann SE | 100.0 | 100.0 | EUR | 2,550 | H, DL | ||
Hoffmann IT & General Services GmbH | 100.0 | 100.0 | EUR | 25 | DL | ||
Hoffmann Group System GmbH | 100.0 | 100.0 | EUR | 100 | DL | ||
Proserve Vertriebs- und Beratungs GmbH | 100.0 | 100.0 | EUR | 26 | H | ||
Simple System GmbH | 100.0 | 100.0 | EUR | 26 | V | ||
Nuremberg | Hoffmann Nürnberg GmbH Qualitätswerkzeuge | 100.0 | 100.0 | EUR | 625 | V | |
Hoffmann Supply Chain GmbH | – | 100.0 | EUR | 75 | DL | ||
Hoffmann Supply Chain GmbH & Co. KG (former Hoffmann Supply Management GmbH & Co. KG) | 100.0 | 100.0 | EUR | 75 | DL | ||
Supply Chain Verwaltungs GmbH | 100.0 | 100.0 | EUR | 25 | DL | ||
Oberursel | SFS Group Germany GmbH | 100.0 | 100.0 | EUR | 5,000 | V, P | |
Reutlingen | Garant Productions GmbH | 100.0 | 100.0 | EUR | 25 | P | |
Schramberg | Ludwig Hettich Holding GmbH & Co. KG | 51.0 | 51.0 | EUR | 2,500 | H | |
Ludwig Hettich Verwaltungs-GmbH | 51.0 | 51.0 | EUR | 26 | H | ||
HECO Schrauben GmbH & Co. KG | 51.0 | 51.0 | EUR | 1,230 | V, P | ||
Denmark | Copenhagen | Hoffmann Danmark ApS | 100.0 | 100.0 | DKK | 125 | V |
Roskilde | Jevith A/S | 100.0 | 100.0 | DKK | 500 | V | |
Estonia | Tallinn | SFS Group Finland Oy Eesti Filiaal | 100.0 | 100.0 | EUR | n/a | V |
Finland | Nummela | SFS Group Finland Oy | 100.0 | 100.0 | EUR | 84 | V |
France | Drusenheim | Hoffmann France SAS | 100.0 | 100.0 | EUR | 500 | V |
Saint-Projet | HECO France Sarl | 51.0 | 51.0 | EUR | 8 | V | |
Valence | SFS Group SAS | 100.0 | 100.0 | EUR | 3,078 | V, P | |
United Kingdom | Leeds | SFS Group Fastening Technology Ltd. | 100.0 | 100.0 | GBP | 2,000 | V, P |
London | Hoffmann UK Quality Tools Ltd. | 100.0 | 100.0 | GBP | 5,973 | V | |
India | Pune | Hoffmann Quality Tools India Pvt. Ltd. | 100.0 | 100.0 | INR | 528,750 | V |
SFS Group India Pvt. Ltd. | 99.7 | 99.7 | INR | 46,654 | V, P | ||
Italy | Pordenone | SFS Group Italy S.r.l. unipersonale | 100.0 | 100.0 | EUR | 10,000 | V, P |
Vigonza | Hoffmann Italia S.p.A. | 100.0 | 100.0 | EUR | 500 | V | |
Canada | Dundas | SFS Group Canada Inc. | 100.0 | 100.0 | CAD | 4,000 | V, P |
Malaysia | Johor Bahru | Unisteel Technology (M) Sdn Bhd | 100.0 | 100.0 | USD | 1,372 | V, P |
Subang Jaya | Hoffmann Quality Tools (Malaysia) Sdn Bhd | 100.0 | 100.0 | MYR | 16,024 | V | |
Mexico | Puebla | Hoffmann Quality Tools Mexico S. de R.L. de C.V. | 100.0 | 100.0 | MXN | 9,150 | V |
Querétaro | SFS Group Fastening Technology Mexico S.A. | 100.0 | 100.0 | MXN | 50 | V | |
Netherlands | Borne | Hoffmann Quality Tools B.V. | 100.0 | 100.0 | EUR | 37 | V |
Helmond | SFS Group the Netherlands B.V. | 100.0 | 100.0 | EUR | 18 | V, P | |
Norway | Frogner | SFS Group Norway AS | 100.0 | 100.0 | NOK | 2,030 | V |
Austria | Brunn am Gebirge | SFS Group Germany GmbH, Brunn am Gebirge Branch | 100.0 | – | EUR | n/a | V |
Korneuburg | SFS Group Austria GmbH | 100.0 | 100.0 | EUR | 146 | V, P | |
Zell am Moos | Hoffmann Austria Qualitätswerkzeuge GmbH | 100.0 | 100.0 | EUR | 35 | V | |
Poland | Poznan | SFS Group Sp. z o.o. | 100.0 | 100.0 | PLN | 11,937 | V |
Portugal | Lisbon | Hoffmann Iberia Quality Tools S.L. | 100.0 | 100.0 | EUR | n/a | V |
Malveira | SFS Group Fastening Technology (Iberica), S.A.U. Sucursal em Portugal | 100.0 | 100.0 | EUR | n/a | V | |
Romania | Bucharest | Hoffmann Industrial Tools S.R.L. | 100.0 | 100.0 | RON | 10 | V |
Campia Turzii | HECO Schrauben S.r.l. | 51.0 | 51.0 | RON | 37,582 | P | |
Sweden | Strängnäs | SFS Group Sweden AB | 100.0 | 100.0 | SEK | 200 | V, P |
Switzerland | Emmenbrücke municipality of Emmen | Allchemet AG | 100.0 | 100.0 | CHF | 340 | V |
Hallau | Stamm AG | 100.0 | 100.0 | CHF | 500 | V, P | |
Heerbrugg municipality of Widnau | SFS Group International AG | 100.0 | 100.0 | CHF | 5,400 | H | |
SFS Group Schweiz AG | 100.0 | 100.0 | CHF | 12,550 | V, P, DL | ||
Singapore | Singapore | Hoffmann Quality Tools Asia Pacific Pte. Ltd. | 100.0 | 100.0 | SGD | 12,865 | V |
Unisteel Technology Limited | 100.0 | 100.0 | USD | 340,443 | V | ||
Slovakia | Bratislava | Hoffmann Qualitätswerkzeuge SK s.r.o. | 100.0 | 100.0 | EUR | 7 | V |
Slovenia | Ljubljana | EPRO D.O.O. | 100.0 | – | EUR | 14 | V |
Hoffmann kvalitetna orodja d.o.o. | 100.0 | 100.0 | EUR | 500 | V | ||
Spain | Madrid | Etanco S.A.U. | 100.0 | – | EUR | 301 | V |
Hoffmann Iberia Quality Tools S.L. | 100.0 | 100.0 | EUR | 50 | V | ||
Sondika-Bizkaia | SFS Group Fastening Technology (Iberica), S.A.U. | 100.0 | 100.0 | EUR | 975 | V | |
Taiwan | Kaohsiung | Unisteel Technology Limited Taiwan Branch | 100.0 | 100.0 | NTD | n/a | DL |
Czechia | Ejpovice | Hoffmann Qualitätswerkzeuge CZ s.r.o. | 100.0 | 100.0 | CZK | 100 | V |
Turnov | SFS Group CZ s.r.o. | 100.0 | 100.0 | CZK | 205,000 | V, P | |
Türkiye | Torbali-Izmir | SFS Group TR San. ve Tic. A.Ş. | 95.1 | 95.1 | TRY | 23,109 | V, P |
SFS Group Pazarlama A.S. | 95.1 | 95.1 | TRY | 100 | V | ||
Hungary | Budapest | Hoffmann Hungary Quality Tools Kft. | 100.0 | 100.0 | HUF | 3,000 | V |
Janossomorja | SFS Group Hungary Kft. | 100.0 | 100.0 | HUF | 412,500 | V, P | |
USA | Arlington Heights, IL | Pro Fastening Systems Inc. | 100.0 | – | USD | 5 | V |
Franklin, MA | Tegra Medical, LLC | 100.0 | 100.0 | USD | 137,839 | V, P | |
Tegra Medical CR, LLC | 100.0 | 100.0 | USD | – | H | ||
Knoxville, TN | Hoffmann Quality Tools USA, Inc. | 100.0 | 100.0 | USD | 6,000 | V | |
Pittsburgh, PA | Triangle Fastener Corporation | 100.0 | 100.0 | USD | 1 | V | |
Watertown, CT | Truelove & Maclean, Inc. | 100.0 | 100.0 | USD | 1 | V, P | |
Wyomissing, PA | SFS Group USA, Inc. | 100.0 | 100.0 | USD | 37,750 | V, P | |
DL = Services, P = Production, V = Sales, H = Holding, L = in Liquidation
The closing date of all companies, except of Hoffmann Quality Tools India Pvt. Ltd., is December 31.
2024
SFS Group Belgium B.V. was established with a share capital of EUR 0.02 million. The Brunn am Gebirge branch of SFS Group Germany GmbH was set up. Atrium 296. Europäische VV SE was established with a share capital of EUR 0.12 million.
Hoffmann Supply Chain GmbH was merged into Hoffmann Supply Chain GmbH & Co. KG.
2023
Hoffmann Asset Management GmbH was renamed Supply Chain Verwaltungs GmbH. SFS intec Oy was renamed SFS Group Finland Oy. SFS intec S.r.l. unipersonale was renamed SFS Group Italy S.r.l. unipersonale. SFS intec, Inc. was renamed SFS Group Canada Inc. Guardian B.V. was renamed SFS Group the Netherlands B.V. SFS intec Baglanti Teknolojileri Sanayi ve Ticaret A.S. was renamed SFS Group TR San. ve Tic. A.Ş.
GESIPA Blindniettechnik GmbH was merged into SFS Group Germany GmbH. Simple System SAS was merged into Simple System GmbH. Unisteel Fastening Systems (Shanghai) Co., Ltd. was merged into Unisteel Technology (China) Co., Ltd.
Hoffmann Supply Management GmbH & Co. KG was established with a share capital of EUR 0.075 million.
Joint ventures
Shareholding in % | Share capital in 1,000 | ||||||
Country | Registered office | Name of the company | 2024 | 2023 | Currency | Activities | |
China | Tianjin | Sunil SFS intec Automotive Parts (Tianjin) Co., Ltd. | 50.0 | 50.0 | CNY | 212,483 | V, P |
Transaction with related parties are generally conducted based on usual market conditions.
Business relationships with related parties
Business transactions with members of the Board of Directors and of the Group Executive Board as well as related companies are summarized in the table below:
2024 | 2023 | |
Sales of goods and services | 2.9 | 3.0 |
Purchases of goods and services | 1.1 | 1.2 |
Receivables | 0.2 | 0.2 |
Payables | 0.1 | 0.1 |
The sales of goods and services mainly include IT, HR and finance services to companies owned by the founding families.
Business relationship with pension funds
The SFS Group charges CHF 0.6 million (PY CHF 0.6 million) in connection with the administration of the SFS pension fund and the patronage fund. Further business relationships with the pension fund include expenses of CHF 0.5 million (PY CHF 0.3 million).
Business relationships with associates and joint ventures
2024 | 2023 | |
Sales of goods and services | 2.0 | 0.5 |
Receivables | 0.3 | 0.3 |
Bank guarantees | 8.4 | 11.1 |
SFS is not aware of any events that occurred after the balance sheet date that could have a material impact on the consolidated financial statements for the financial year ended December 31, 2024.
The consolidated financial statements of the SFS Group were approved by the Audit Committee and the Board of Directors on March 6, 2025, and are subject to final approval at the Annual General Meeting of shareholders, which will take place on April 30, 2025.