Key figures
Continuous progress
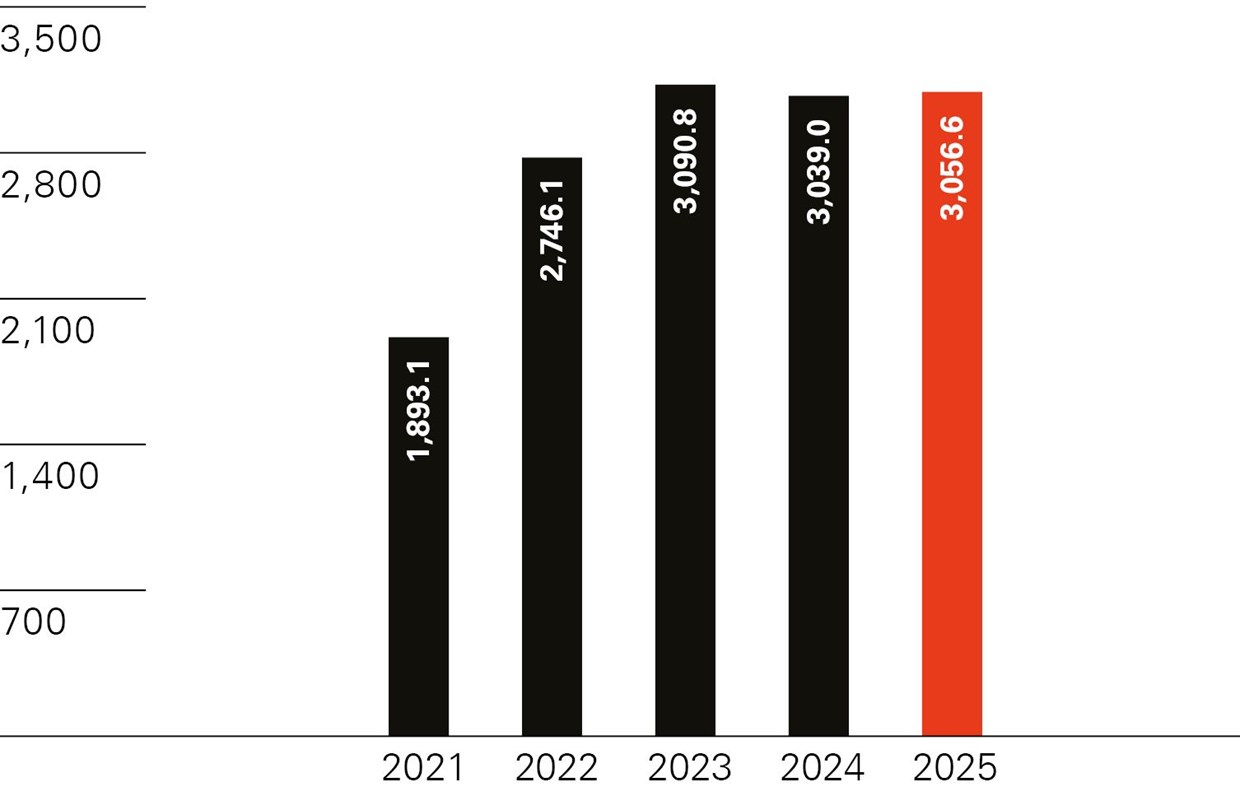
Sales growth generated
Sales in CHF million
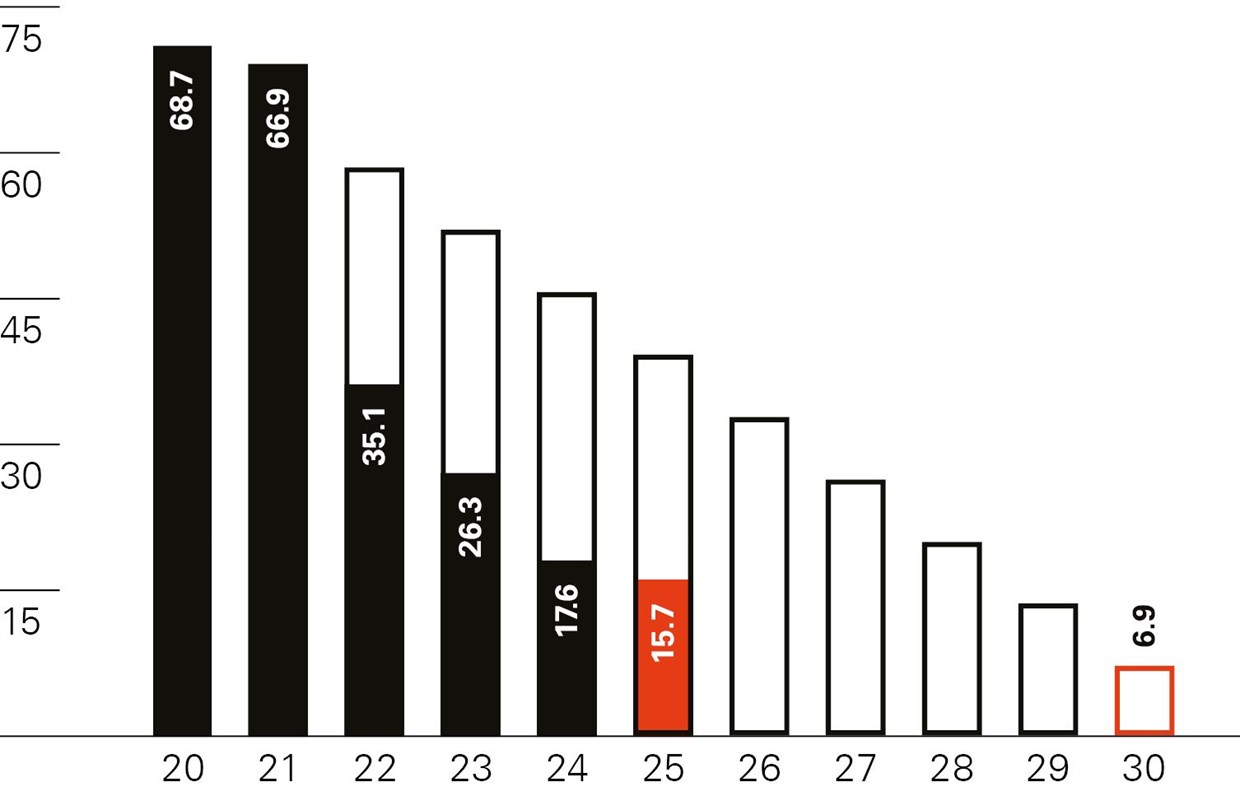
Emissions (Scope 1+2) reduced by –77.1% vs. 2020
CO2 emissions in metric tons/net sales
Solid profitability achieved
EBIT adjusted in % of net sales
Accident rate significantly improved
Number of accidents/million hours worked
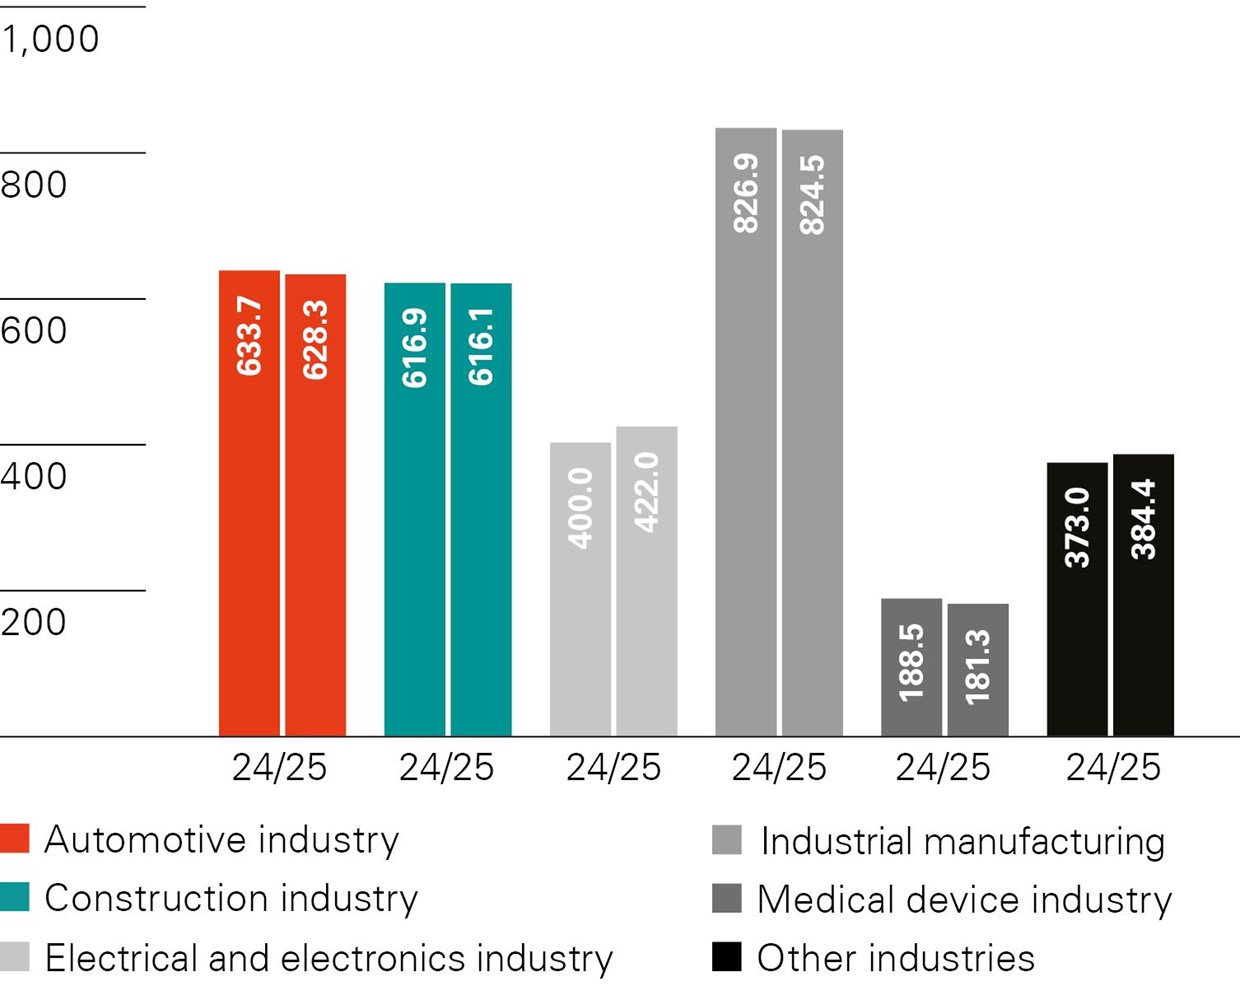
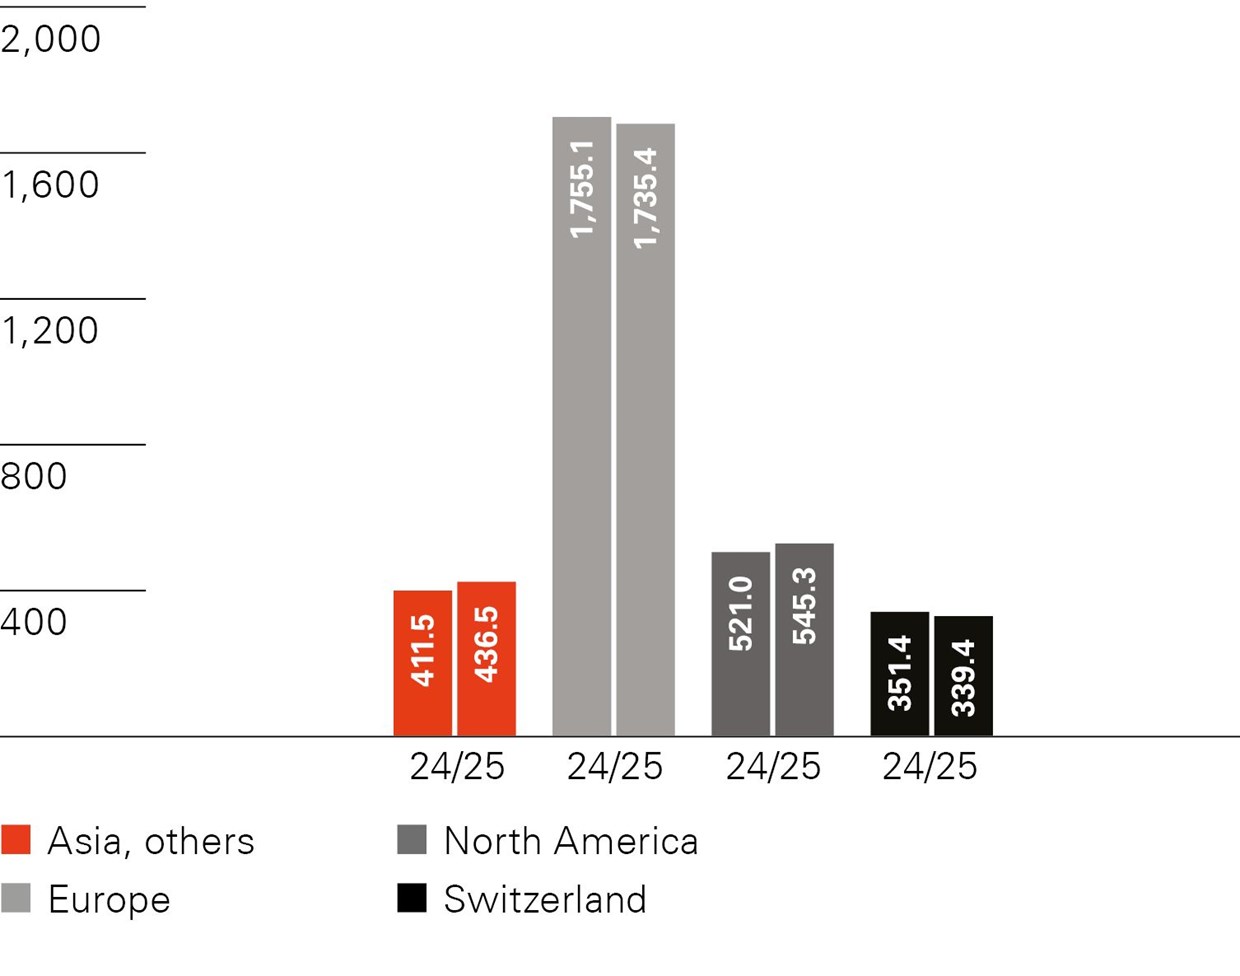
Pleasing trend recorded in Asia and North America
Sales by end market/region in CHF million
Sustainable results
Income statement in CHF million | 2025 | 2024 | 2023 | 2022 | 2021 |
Sales | 3,056.6 | 3,039.0 | 3,090.8 | 2,746.1 | 1,893.1 |
Change to previous year in % | 0.6 | –1.7 | 12.6 | 45.1 | 11.0 |
thereof currency effects | –2.9 | –1.9 | –4.1 | –1.9 | –0.1 |
thereof change in scope of consolidation | 0.6 | 0.1 | 14.6 | 37.9 | 0.8 |
thereof organic growth | 2.9 | 0.1 | 2.1 | 9.1 | 10.3 |
Net sales | 3,045.4 | 3,031.1 | 3,073.0 | 2,738.7 | 1,897.3 |
EBITDA | 466.6 | 479.8 | 486.0 | 448.1 | 407.1 |
in % of net sales | 15.3 | 15.8 | 15.8 | 16.4 | 21.5 |
Operating profit (EBIT) | 324.3 | 350.2 | 358.6 | 330.3 | 301.7 |
in % of net sales | 10.6 | 11.6 | 11.7 | 12.1 | 15.9 |
Operating profit (EBIT) adjusted1 | 371.0 | 350.2 | 358.6 | 353.2 | 298.6 |
in % of net sales | 12.2 | 11.6 | 11.7 | 12.9 | 15.7 |
Net income | 220.2 | 242.7 | 268.5 | 270.6 | 248.0 |
in % of net sales | 7.2 | 8.0 | 8.7 | 9.9 | 13.1 |
Balance sheet in CHF million | |||||
Assets | 2,512.7 | 2,612.2 | 2,546.8 | 2,574.2 | 1,839.1 |
Net cash (+)/debt (–) | –164.8 | –335.1 | –445.3 | –477.7 | 279.1 |
Equity | 1,618.8 | 1,559.2 | 1,375.7 | 1,303.6 | 1,450.4 |
in % of assets | 64.4 | 59.7 | 54.0 | 50.6 | 78.9 |
Cash flow statement in CHF million | |||||
Cash flow from operating activities | 377.3 | 375.0 | 313.4 | 287.9 | 324.5 |
Purchase of property, plant, equipment and intangible assets | –103.7 | –148.9 | –174.0 | –171.0 | –121.4 |
Acquisition (–)/Disposal (+) of subsidaries, net of cash | –7.2 | –17.1 | –10.3 | –519.1 | –7.6 |
Employees | |||||
Employees in FTE | 13,646 | 13,689 | 13,198 | 13,282 | 10,509 |
Financial key ratios (unaudited) | |||||
ROCE in %2 (Return on Capital Employed) | 21.1 | 19.4 | 20.4 | 22.7 | 26.1 |
ROIC in %2 (Return on Invested Capital) | 9.3 | 8.4 | 8.9 | 8.9 | 11.2 |
Non financial key ratios (Limited Assurance 2025) | |||||
GHG emissions Scope 1+2 in metric tons/net sales3 | 15.7 | 17.6 | 26.3 | 35.1 | 66.9 |
Share of renewable electricity in %3 | 81.5 | 73.9 | 41.2 | 52.9 | 39.7 |
Number of accidents/million hours worked3 | 2.9 | 4.2 | 4.1 | 4.1 | 4.2 |
Share key ratios | |||||
Earnings per share in CHF | 5.63 | 6.21 | 6.84 | 6.95 | 6.51 |
Payout per share in CHF4 | 2.50 | 2.50 | 2.50 | 2.50 | 2.20 |
Payout in CHF million | 97.3 | 97.2 | 97.2 | 97.2 | 82.0 |
Payout ratio in %5 | 44.4 | 40.3 | 36.5 | 36.4 | 33.6 |
1Adjustments are explained in the Information on the publication section
2Calculation of the key figure is shown in the Information on the publication section
3The figures for previous years have been restated due to a change in the consolidation methodology for joint ventures and expanded data collection
4Proposal to SFS Group’s Annual General Meeting on April 22, 2026
5Calculation is based on the net income attributable to shareholders of SFS Group AG